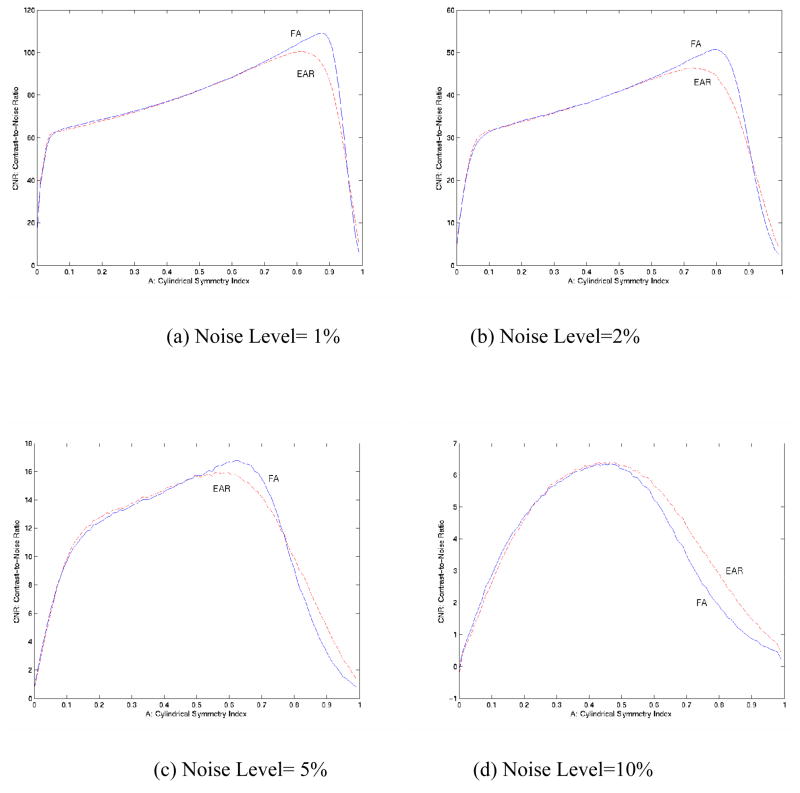
Figure 6. Contrast-to-Noise Ratios (CNR) with a Difference in A (cylindrical symmetry) of 0.01 for EAR and FA Using Monte Carlo Simulations with 200,000 Repetitions.
(a) Noise level 1%; (b) Noise level 2%; (c) Noise level 5%; (d) Noise level 10%. CNRs of EAR and FA are generally similar. When noise increases, the CNR for EAR tends to be higher than that of FA.

