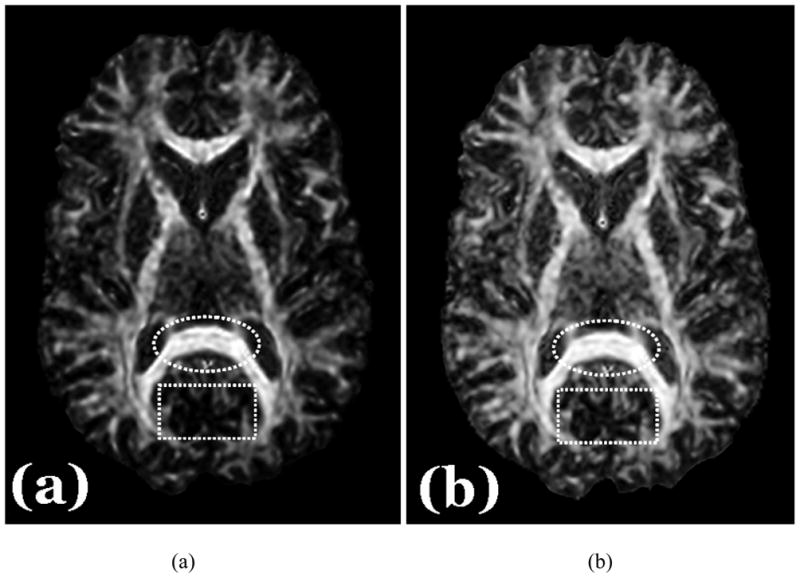
Figure 8. In vivo DAI Maps in a Human Subject.

(a) FA map; (b) EAR map. EAR typically provides a CNR within tissues that is similar to that for FA, although EAR has relatively greater SNR. Consequently, the EAR map appears smoother than the FA map (e.g. the region of the corpus callosum within the dotted circle). EAR, on the other hand, provides a higher CNR across differing tissue types (white matter vs. other tissues), producing clearer delineation of small structures in regions of mixed tissue types (e.g. the small structural details in the dashed rectangle). Better CNR should not be confused with the visibility of the major fiber pathways. Thus in the FA map, only the skeletons of major fiber pathways (a portion of the white matter) are prominently visible, because FA does not offer a well-balanced CNR for all ranges of anisotropy values across white matter and other tissue types. In contrast, almost all white matter regions are visible in the EAR map.
