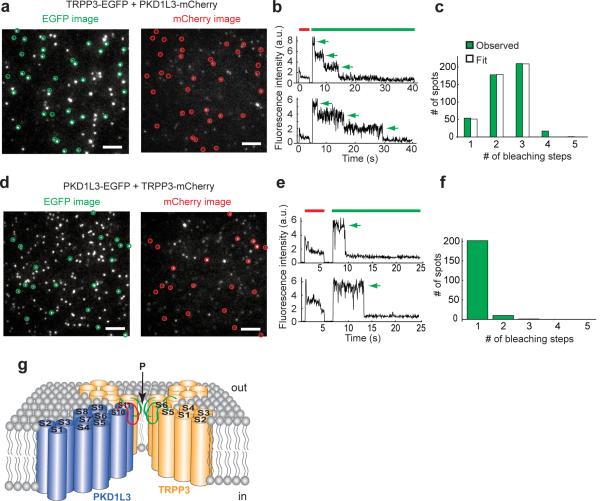
Figure 4. The PKD1L3/TRPP3 heteromeric channel has a 1:3 subunit stoichiometry.
(a and d) TIRF images of EGFP fluorescence from an oocyte expressing the indicated constructs, showing spots that exhibited EGFP and mCherry dual fluorescence and were immobile (circles). Other spots do not fit analysis criteria. Scale bar, 2 μm. (b and e) Time course of photobleaching of two representative dual-fluorescence spots of either TRPP3-EGFP + PKD1L3-mCherry (b) or PKD1L3-EGFP + TRPP3-mCherry (e), showing EGFP bleaching steps (arrows). EGFP and mCherry excitation is indicated by green and red bar, respectively. (c and f) Distribution of observed EGFP bleaching steps (green bars) for dual-fluorescence spots of either TRPP3-EGFP + PKD1L3-mCherry (c) or PKD1L3-EGFP + TRPP3-mCherry (f). In c, observed EGFP bleaching steps are compared to a binomial distribution assuming that 3 EGFP molecules exist in each spot and based on 78% of EGFPs being fluorescent (white bars). (g) Schematic diagram of the heteromeric PKD1L3/TRPP3 channel viewed from the side. P: channel pore. Green and red loops depict the putative selectivity filter formed by the pore loops shown in Fig. 2a. The inner pore is presumed to be lined by the 11th transmembrane segment (S11) of PKD1L3 and the 6th transmembrane segment (S6) of TRPP3.
(Yang)

