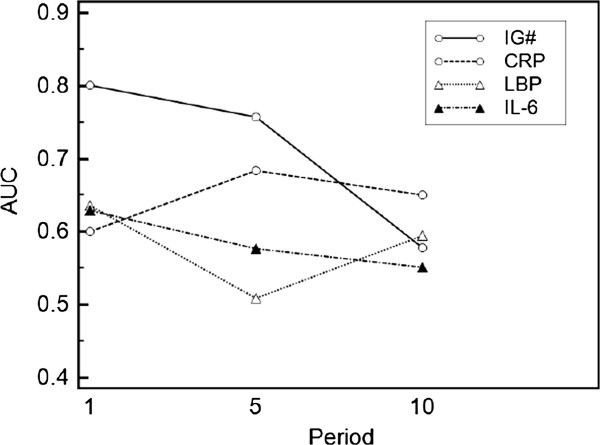
Figure 2.
Prediction of infection. Predictive value of clinical parameters for infection was computed using receiver operating characteristic (ROC) curves and area under the curve (AUC). Parameter differences between non-infected vs. infected patients were assessed using Mann–Whitney U-test; significance is quoted as P < 0.05*; P < 0.005**; P < 0.0005*** (n = 70). Positive predictive value [PPV] and negative predictive value [NPV] were calculated for each period; infection prevalence of 55.71% in period 1, 67.14% in period 5 and 71.43% in period 10. AUC values are plotted against study period and numerical data of AUC [PPV / NPV] are given in the table. IG#, immature granulocyte count; CRP, C-reactive protein; LBP, lipopolysaccharide binding protein; IL-6, interleukin-6; SOFA, sequential organ failure assessment score.

