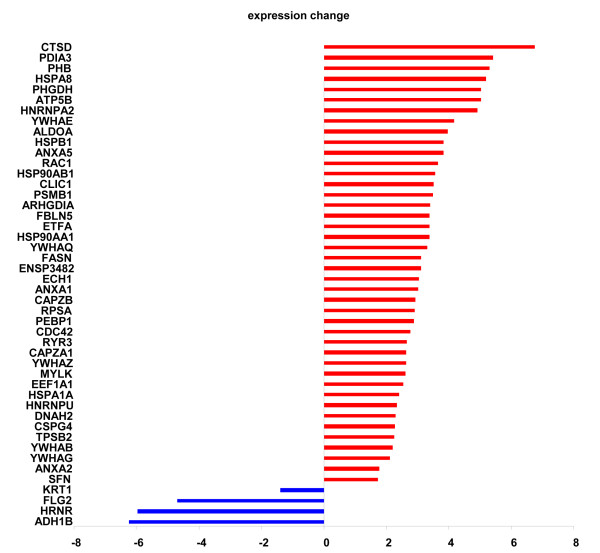
Figure 2.
Fold-changes in abundance modified proteins in GCMN compared to normal skin. The histogram displays the protein symbol and the averaged fold-change of each differentially expressed protein in GCMN. A total of 46 proteins were differentially expressed, with 4 proteins downregulated and 42 upregulated in GCMN compared to normal skin.

