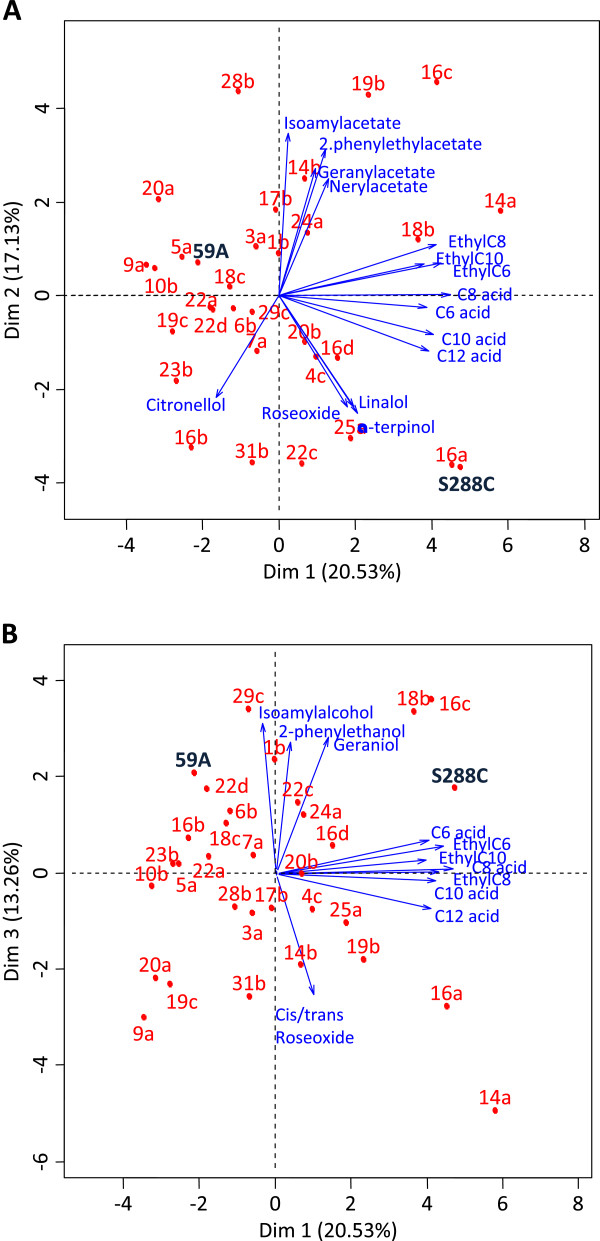
Figure 1.
Principal component analysis presenting the variability in the concentration of volatile compounds produced by the various segregants and parent strains (experiment A). A: Components 1 and 2 representing 37.7% of the global variation; B: Components 1 and 3 representing 33.8% of the global variation. Segregants are indicated in red, aroma compound vectors are given in blue.

