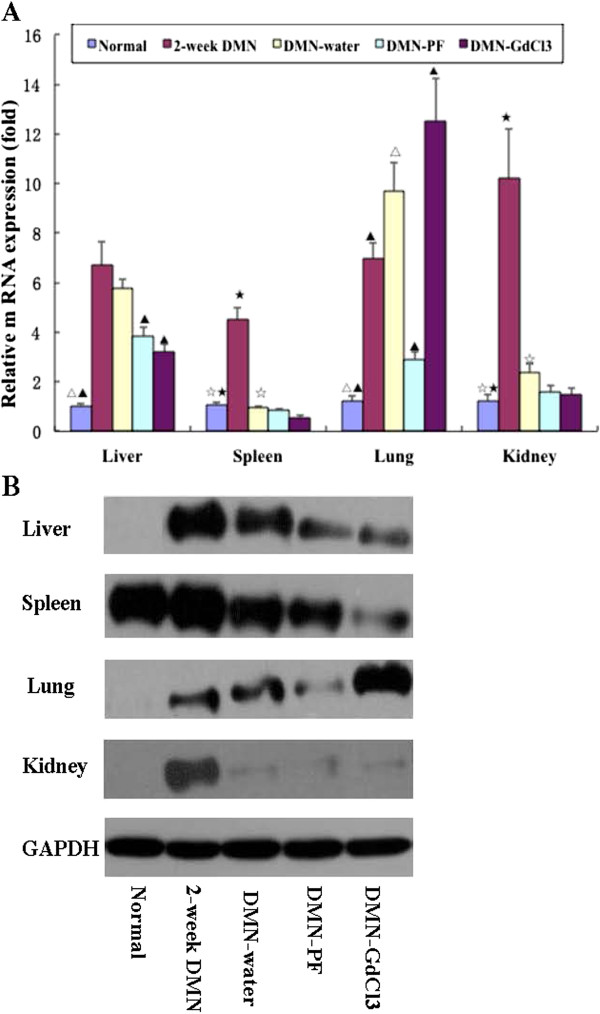
Figure 4.
Effects of PF on CD68 expression in different organs in DMN-induced rat liver fibrosis. (A) CD68 was measured by real-time PCR. As an internal control, 18S rRNA was amplified. The data represented the mean ± SD. ▴p<0.05 and ▴▴p<0.01 versus DMN-water rats; △p<0.05 and △△p<0.01 versus 2-week DMN rats; LSD test were used for group comparisons in CD68 detection in the liver and lung. p<0.05 versus 2-week DMN rats; ⋆p<0.05 versus DMN-water rats Kruskal-Wallis test were used for group comparisons in CD68 detection in the spleen and kidney, n=3. (B) CD68 were detecting by western blotting.

