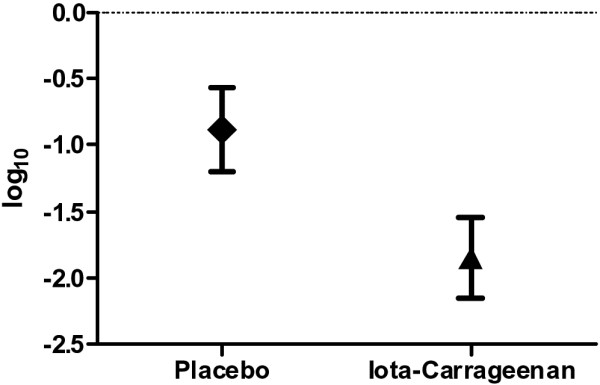
Figure 5.

Reduction of viral load between visits 1 and 2. The log10 of the virus copies was determined by quantitative PCR analysis, and the difference in viral load between visits was calculated for the verum and the placebo group. The log10 difference in total virus copy number (±SEM) between visits 1 and 2 is shown (p < 0.026).
