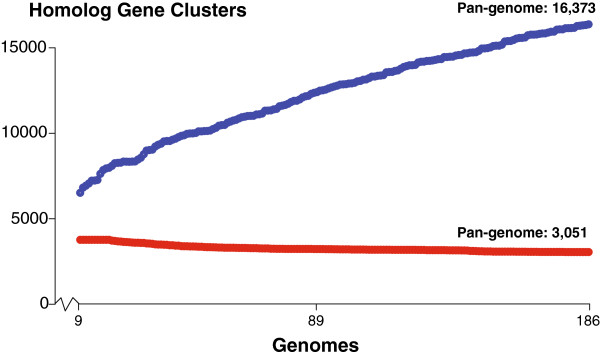
Figure 1.

Progress of Homolog Gene Cluster calculation as each genome is added. Two circles exist (red & blue) for each genome added from genome no. 9 up to and including genome no. 186. Red represents the number of core HGCs after the addition of a genome and blue represents the number of pan HGCs after the addition of a genome.
