
Figure 3.
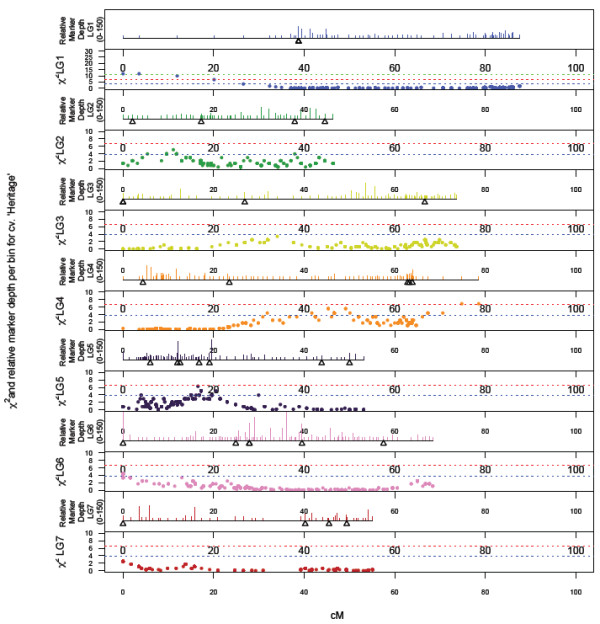
Genome-wide patterns of marker density/depth and segregation distortion, plotted as a function of Chi-squared value for monogenic marker segregation ratios against marker position on the each of the seven LGs of the ‘Heritage’ map. Dashed lines indicate Chi-squared significance values of P ≤ 0.05, P ≤ 0.01 and P ≤ 0.01. The scale in the upper panel of each LG is from 1 to 150 markers.