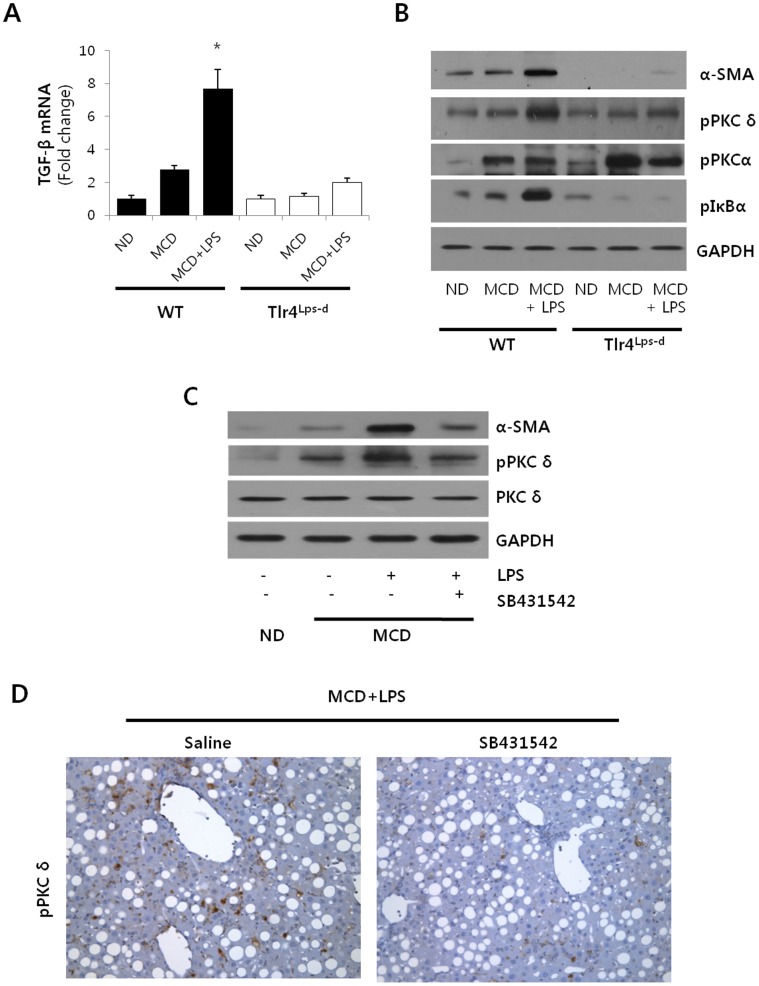
Figure 3. Involvement of PKCδ in TGFβ1-induced α-SMA expression.
(A) Hepatic levels of TGF β1 mRNA from ND, MCD and LPS-injected MCD mice in WT or Tlr4Lps-d (CH3/HeJ) were measured by qRT-PCR. Genes were normalized to18S rRNA as an internal standard. *P<0.05 versus the ND group. (B) Mice were injected with 2.5 mg/kg LPS for 6 hours in Tlr4Lps-d (CH3/HeJ) and WT. Liver α-SMA, phospho-PKCδ, phospho-PKCα and phospho-IκBα protein contents were quantified by Western blot. Expression levels were normalized relative to GAPDH. Liver extracts from a pool of three mice in each group were analyzed by Western blot using specific antibodies. (C) Liver tissue extracts were prepared from mice fed MCD diet for 3 weeks and subsequently injected with 2.5 mg/kg LPS and TGFβ1 inhibitor (SB431542). Liver α-SMA, phospho-PKCδ and PKCδ protein contents were quantified by Western blot using an equal amount of total liver proteins. Liver extracts from a pool of three mice in each group were used. (D) Representative liver tissue sections from LPS-treated MCD mice injected with either saline or SB431542 (10 mg/kg) were stained with phospho-PKCδ antibody (original magnification 200×).

