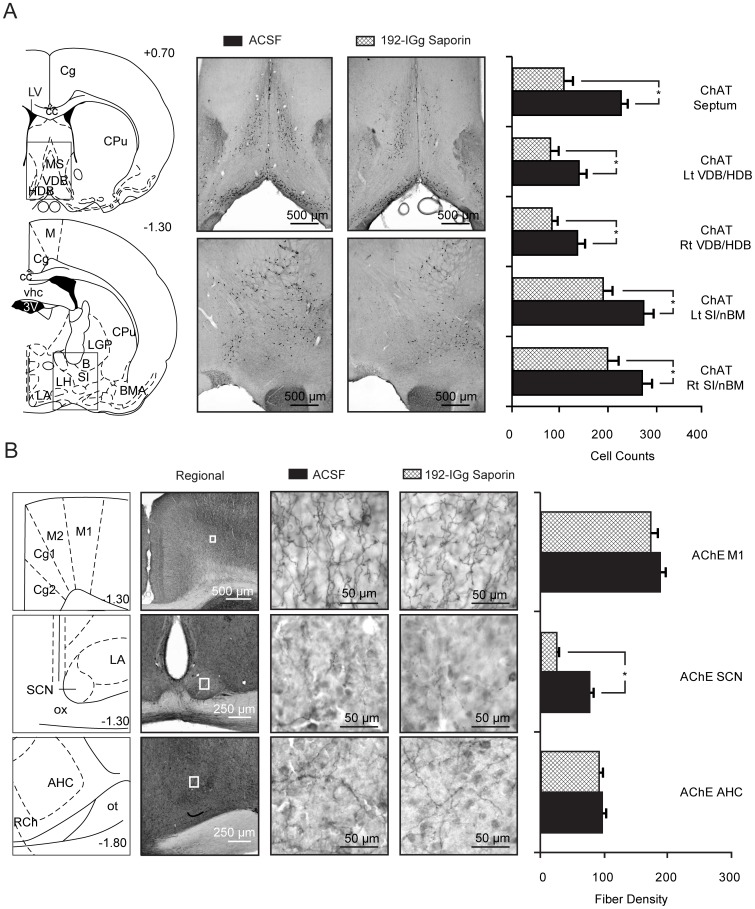
Figure 1. Anatomical results of neurotoxic lesions for animals used in this study.
(Anterior-posterior levels based on Bregma are shown in schematics; scale for all photomicrographs is indicated in the lower right of image): ( A ) Left side provides schematic illustration of coronal sections shown in microphotographs on right. Box outline in schematic represents the boundary of the microphotographs for areas in which ChAT-positive cell bodies were counted. Images are representative for animals that received ACSF infusions (controls) or 192 IgG-saporin infusions. The bar graphs on the right indicate ChAT-positive cell counts for animals by group for each region quantified (* = p<0.05). ( B ) Left side represents schematic of regional sections shown in photomicrographs (center). Box outline in regional photomicrographs represent 40X images shown on right from ACSF and 192 IgG-saporin infused animals, respectively. Bar graph on the right indicate AChE+ fiber counts for animals by group for each region quantified (M1: layer 3/5, SCN, and AHC; * = p<0.01). Abbreviations: 3 V, third ventricle; AHC, anterior hypothalamus; B, basal nuc. of Meynert; BMA, basal medial amygdala; cc, corpus callosum; Cg, cingulate cortex; CPu, Caudate/Putamen; HDB horizontal diagonal band of Broca; LA, lateral anterior hypothalamus; LGP, lateral globus pallidus; LH, lateral hypothalamus; LV, lateral ventricle; M1, primary motor cortex; M2, secondary motor cortex; MS, medial septal nuc.; ot, optic tract; ox, optic chiasm; RCh, retrochiasmatic area; SCN, superchiasmatic nuc.; SI, substantia innominata; VDB, vertical diagonal band of Broca.

