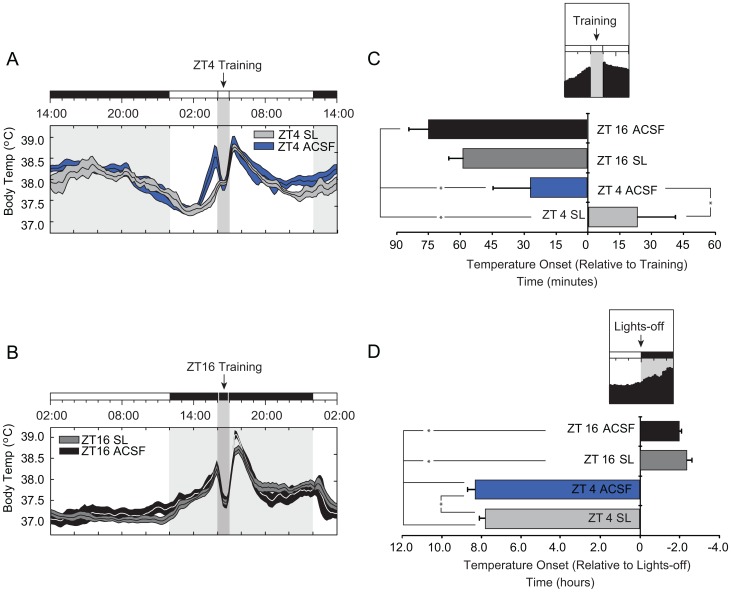
Figure 5. Mean temperature records and phase synchrony for SAT trained animals by treatment group.
( A ) 24 hour binned average of ZT4 trained animals. SAT training (ZT4) is relative to the topmost LD bar (where dark bar = lights-off). The shaded column represents the task training period where daily water is available including the approximate 40 min SAT session in which animals are absent from their home cages and the 20 minute free water period that follows training. Values of zero - occurring when animals are removed from their home cages for training (ZT4-ZT5, or ZT16-ZT17 for ZT4 and ZT16 trained animals, respectively), were adjusted to reflect daily mean values. X-axis is plotted in zeitgeber time (ZT) and y-axis represents mean body temperature grouped by 10 min bins. Histograms are taken from the last 10 days of SAT training, before entering constant conditions. ZT4 SL (light gray), and ZT4 controls (blue) mean averages are plotted ± SEM (shading). ( B ) 24 hour binned average of ZT16 trained animals. ZT16 SL (dark gray), and ZT16 control (black) mean averages are plotted ± SEM (shading). (C ) Mean phase relationship between rises in body temperature (crossing above daily mean) relative to time of SAT training. Activity onset in minutes relative to training time is plotted for each condition (minutes ± SEM; * = p<0.05). Note all animals show significant daily increase before task training with the exception of ZT4 SL animals. (D ) Mean phase relationship between rises in body temperature (crossing above daily mean) relative to time of lights-off. Activity onset in minutes relative to dark-phase is plotted for each condition (minutes ± SEM; * = p<0.05).

