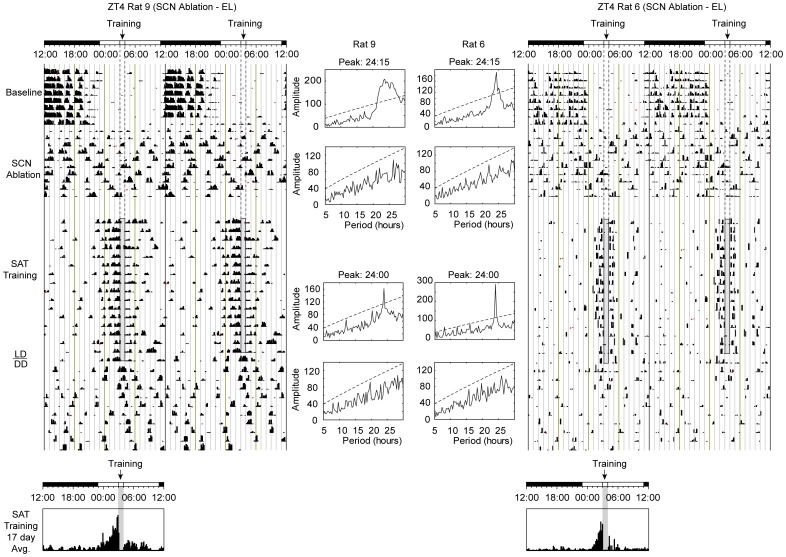
Figure 6. Double-plotted actograms for two SCN ablated (electrolytic lesion - EL) animals training on the SAT at ZT4.
Each line represents 48 hours of locomotor activity collected via running wheels. SAT training (ZT4) is relative to the topmost LD bar (where dark bar = lights-off). The shaded column represents the task training period where daily water is available including the approximate 40 min SAT session in which animals are absent from their home cages and the 20 minute free water period that follows training. The last day of training corresponded to the final day of LD conditions. Circadian actograms are separated into 2 phases with 4 observable activity states: The first phase represents the final 8 days of baseline activity prior to surgery and lesioning of the SCN, followed by the first 10 days of post-lesion activity prior to the onset of SAT training. The second portion of the actogram illustrates the final 17 days of SAT training and the subsequent 10 days of constant conditions (DD). Time histograms below provide averages of running wheel activity for the final 17 days of training shown above on a 24-hour scale. Shaded column represents time of training relative to the LD cycle. In both cases animals show an arrhythmic phenotype following lesioning of the SCN in both LD and DD environments. (Center) Chi-square (χ2) period analysis from 10 consecutive days of activity are represented for pre-surgery (top), post SCN-lesioning (middle-top), SAT training (middle-bottom), and post-training period (bottom) for the corresponding actograms. Values above the dashed line represent significant periodicities (p = 0.05) with peak activity periods noted in instances of significance.

