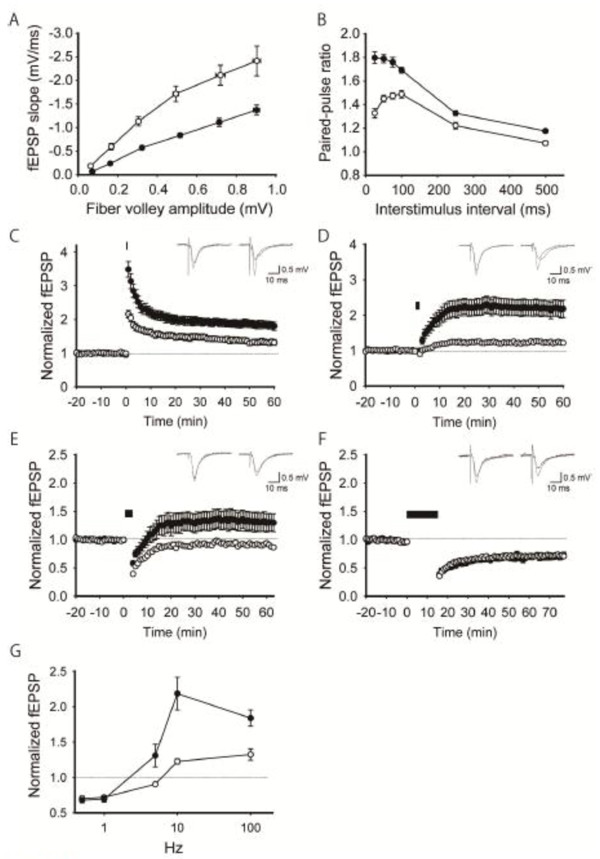
Figure 4.
Enhanced LTP and normal LTD in the hippocampal CA1 region of young adult 1d2d-PSD-95-EGFP KI mice. A, The synaptic input–output relationship in slices from 6- to 8-week-old WT (open circles, n = 16 slices from 4 mice) and KI (filled circles, n = 12 slices from 4 mice) mice. B, Paired pulse facilitation plotted as a function of the interstimulus interval. Filled circles: KI mice (n = 12 slices from 4 mice). Open circles: WT littermates (n = 16 slices from 4 mice). C, LTP by high-frequency stimulation (100 Hz, 100 pulses). Filled circles: KI mice (n = 8 slices from 3 mice). Open circles: WT littermates (n = 7 slices from 3 mice). D, LTP by intermediate-frequency stimulation (10 Hz, 900 pulses). Filled circles: KI mice (n = 10 slices from 4 mice). Open circles: WT littermates (n = 6 slices from 4 mice). E, LTP by low-frequency stimulation (5 Hz, 900 pulses). Filled circles: KI mice (n =7 slices from 5 mice). Open circles: WT littermates (n = 6 slices from 4 mice). F, LTD by low-frequency stimulation (1 Hz, 900 pulses). Filled circles: KI mice (n = 6 slices from 3 mice). Open circles: WT littermates (n = 8 slices from 3 mice). Bars in C-F indicate the period of high/low frequency stimulation. G, Summary of synaptic plasticity at different stimulation intensities in slices from WT (open circles) and KI (filled circles) mice. All values are expressed as mean ± SEM.

