
Figure 1.
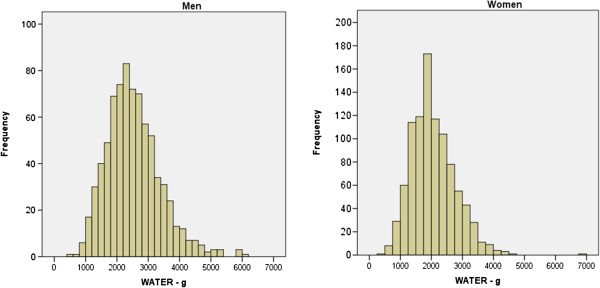
Frequency distribution of total water intake (g/d) over 7 days, by sex.
Official websites use .gov
A
.gov website belongs to an official
government organization in the United States.
Secure .gov websites use HTTPS
A lock (
) or https:// means you've safely
connected to the .gov website. Share sensitive
information only on official, secure websites.
Frequency distribution of total water intake (g/d) over 7 days, by sex.