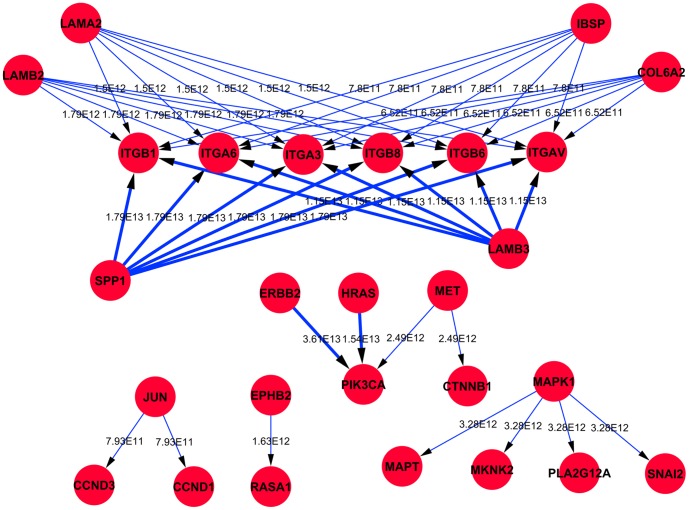
Figure 2. Bioinformatic analysis of monoclonal cell strains with high, middle and low metastatic potentials.
Signal-flow model of the differential gene expression union. The dot represents the gene and the direction of the line represents the direction of the regulation. The number on the line is the regulation weight: the bigger the weight, the thicker the line and the stronger the regulatory ability. The arrow target shape of the line represents the activation regulation mode.

