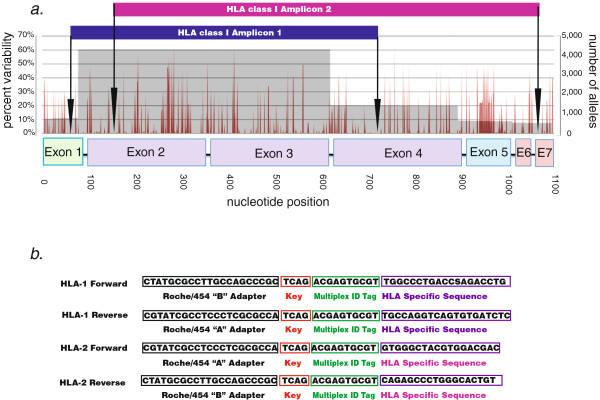
Figure 1.
Positioning and sequence of HLA class I universal amplification primers. An alignment of >4,000 known HLA class I alleles produced a variability profile. (a) The depth of coverage (i.e. the number of alleles at each position in the alignment) is shown in grey, along with the percentage of nucleotide sequence variability (red) and the positioning of the two genotyping amplicons. (b) The sequence and composition of universal amplification primers for amplicon 1 and 2. Note that for amplicon 1 the “A” and “B” adapters were swapped to avoid a primer amplification problem.

