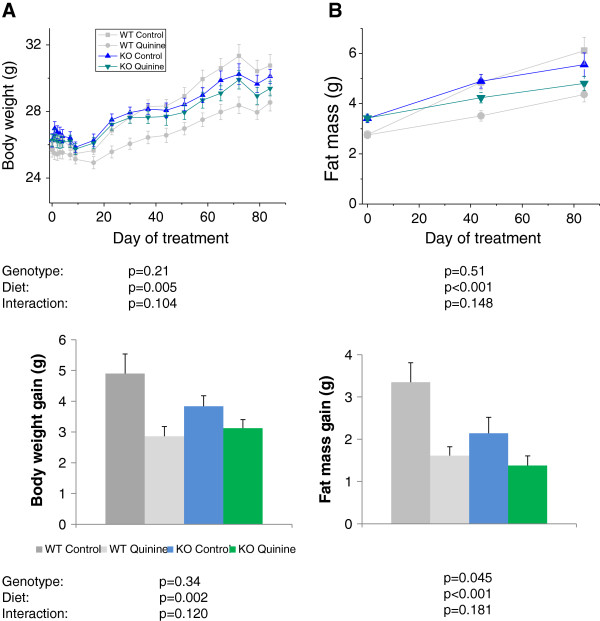
Figure 4.
Body weight and fat mass of WT and Trpm5 knockout mice on control diet or diet + 0.1% quinine. The p values for the effects of diet, genotype and the interaction are shown below each graph. Body weight and fat mass gains are significantly diminished by quinine. Fat mass gain is significantly lower in Trpm5 KO mice. There is a trend for interaction diet*genotype for body weight, were the effect of quinine is larger in the WT than in the knockout background.

