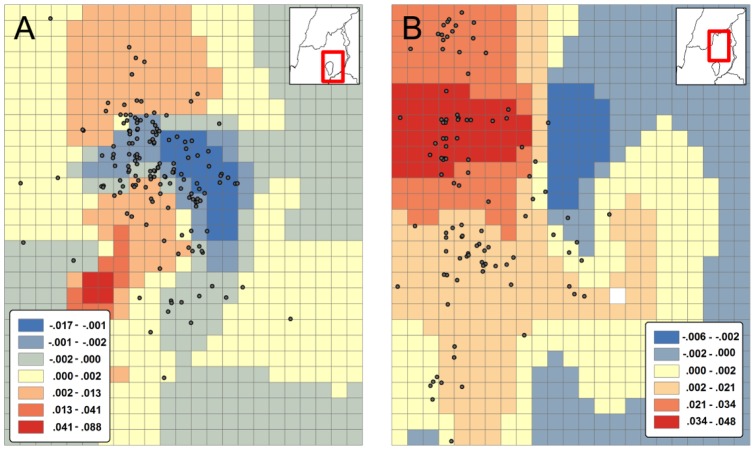
Figure 3. Female (A) and male (B) GWR model coefficients.
For females the best predicting model included only altitude span for each cell. For males the best predicting model included only the altitude standard-deviation for each cell. Also shown are the localities of the bats (upper right corner) in the time frame of the analysis – after the first hour of activity.

