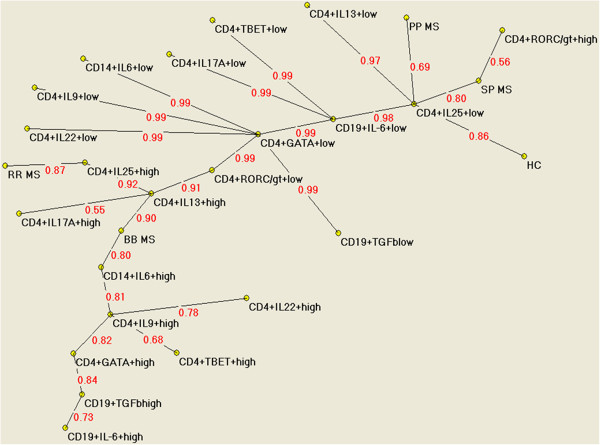
Figure 1.

Semantic connectivity map of the pathway linking immunological markers to different phenotypes of MS. Semantic connectivity map of variables on study: values ranging from 0 (no association) to 1 (the strongest association) express the strength of association.
