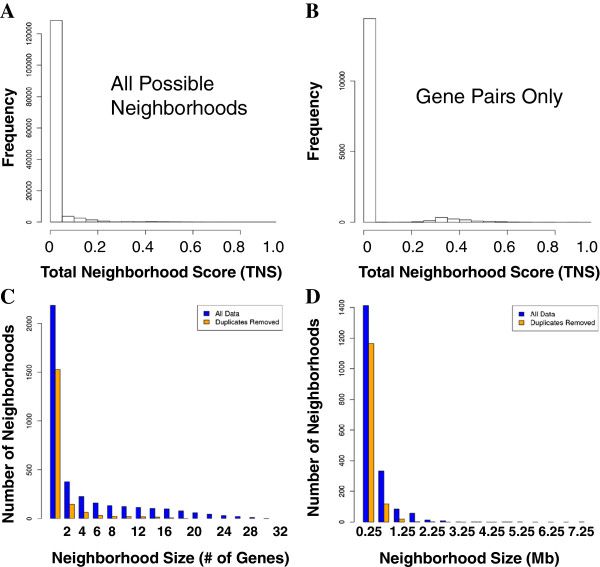
Figure 2.
Genome-wide Neighborhood Scores and Sizes. A-B. Distribution of Total Neighborhood Scores (TNSs) computed from the Microarray Atlas data set including (A) all possible neighborhoods and (B) only possible neighborhoods with two genes. C-D. Distribution of neighborhood sizes (TNS > 0.2) on a (C) gene-wise and (D) base-pair-wise basis.

