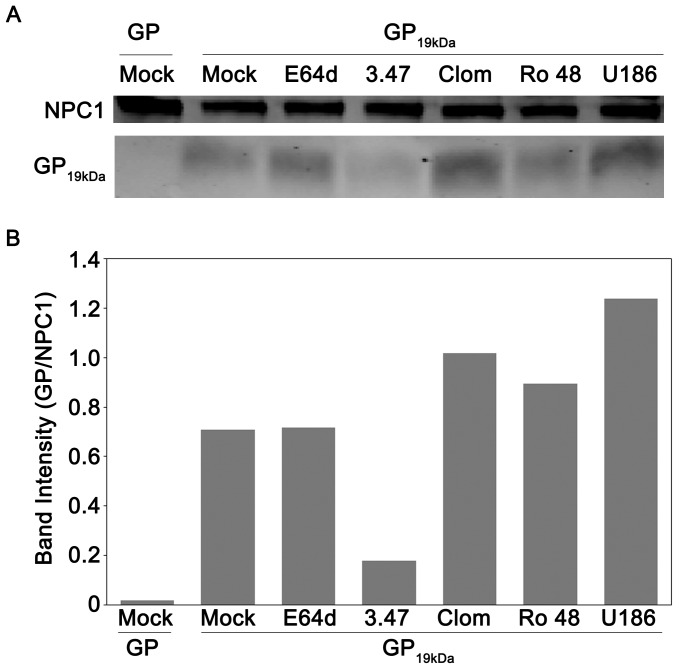
Figure 7. CADs do not disrupt the interaction of 19 kDa GP and NPC1.
(A) NPC1-FLAG-enriched LE/Lys membranes from CHO NPC1 cells were disrupted and then incubated with inhibitors for 30 min at RT: mock (4% DMSO), E64d (10 µM), compound 3.47 (13 µM), clomiphene (242 µM), Ro 48-8071 (174 µM), and U18666A (800 µM); each inhibitor was used at a concentration 100 fold over its IC50 for inhibition of infection. The samples were then incubated with 3 µg uncleaved (GP) or cleaved (GP19 kDa) EBOV GP ectodomains for 1 hr at RT. Samples were then lysed, and incubated overnight with anti-FLAG beads. Bound NPC1 and GP were then eluted from beads, and run on an SDS-PAGE gel. The gel was then transferred, blotted for both NPC1 and EBOV GP, and imaged for fluorescent signal. As predicted, uncleaved GP (∼130 kDa) did not co-precipitate with NPC1 [20], [24]. (B) The intensities of the GP, GP19 kDa, and NPC1 bands from each sample of the blot shown in Fig. 7A were quantified and GP or GP19 kDa was normalized to its respective NPC1 band signal. The experiment was conducted four times with similar results, and a representative experiment is shown.

