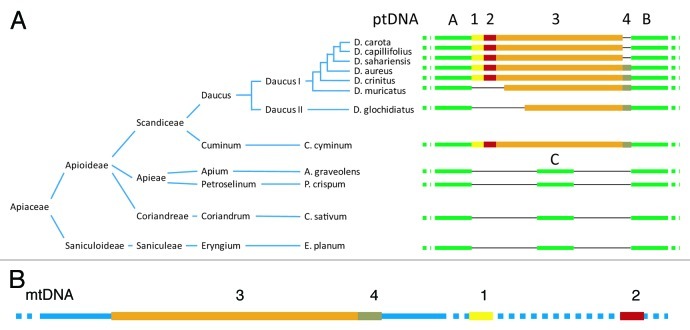
Figure 1. Presence of DcMP insertion variants in the plastid genome of Apiaceaeous species according to the reconstructed phylogeny.15,16 (A) Yellow, red, orange and brown segments 1 to 4 represents the region of plastid (pt) DNA transferred from the mitochondrial genome (dubbed DcMP). It has likely been transferred in a single event with the present organization of the transferred sequences in the carrot mitochondrial genome depicted in (B); Green lines A and B denote conserved plastid sequences flanking the insertion; green line C represents the 339 nt region that have been deleted in the Scandiceae plastid genomes; thin black lines denote missing regions. (B) Blue lines denote mitochondrial sequences of carrot; colored segments represent the DcMP regions 1–4; dashed lines represent mtDNA segments separating regions 1–4. The scheme is not drawn to scale.

An official website of the United States government
Here's how you know
Official websites use .gov
A
.gov website belongs to an official
government organization in the United States.
Secure .gov websites use HTTPS
A lock (
) or https:// means you've safely
connected to the .gov website. Share sensitive
information only on official, secure websites.
