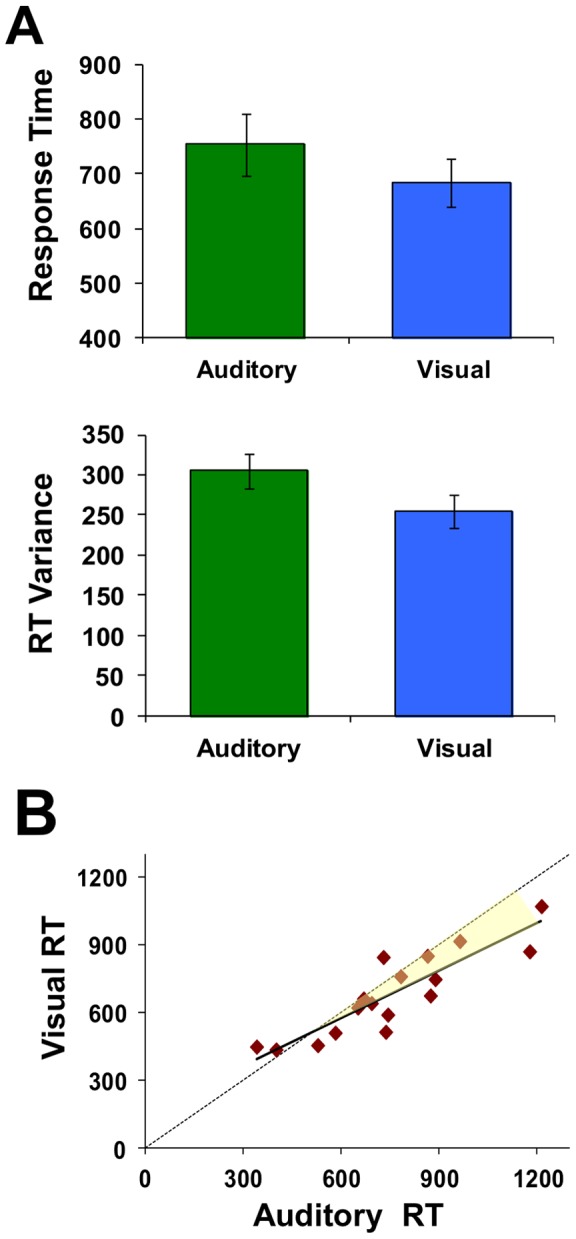
Figure 4. Response time per sensory modality.

Subjects responded faster (lower median response times) and more consistently (lower mean within-subject variance) with visual than auditory task stimuli (A). Error bars depict standard error across subjects. There was a high correlation across subjects' response times between the two tasks (r = 0.883, p<.05) such that subjects with longer responses during the visual task also tended to take longer to respond with auditory targets as well (B). The shaded area emphases how this relative difference increases consistently across subjects.
