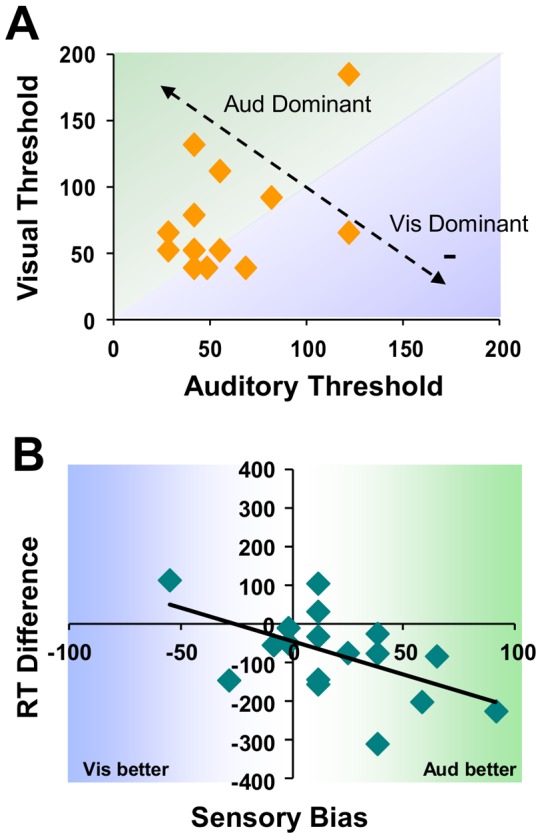
Figure 5. Temporal thresholds and the relation to RT.

Temporal thresholds for each modality derived prior to the study (via staircase procedure) show no systematic relationship across subjects (A). Shaded areas represent whether a subject shows more temporal acuity in the visual (blue) or auditory (green) domain. There is, however, a high correlation between the amount of sensory bias (difference between visual and auditory thresholds) observed and reaction time differences across subjects (B).
