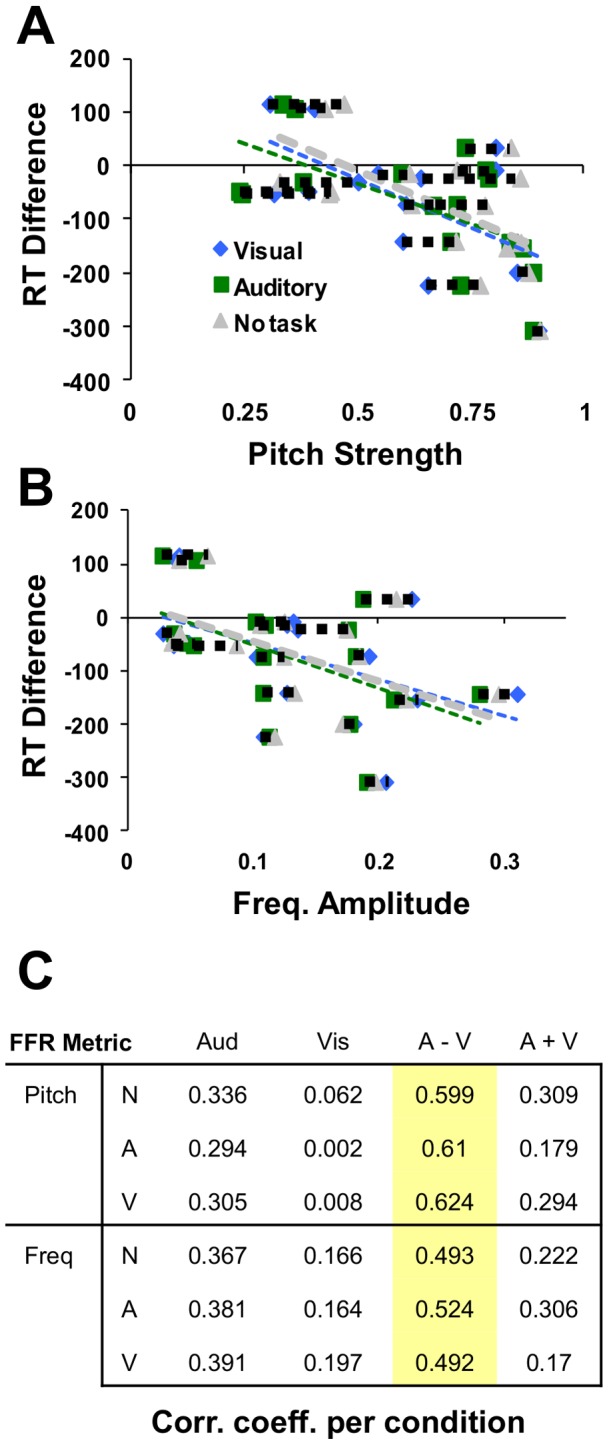
Figure 6. RT changes relative to each FFR metric.

Subjects with higher pitch strength (A) and higher target frequency response amplitude (B) also showed the greatest response time difference (increasingly negative values) when comparing auditory and visual performance. Dashed lines connect each subject's data for the three conditions. This relationship between RT and each FFR metric is consistent regardless of which task (auditory, visual, or no-task, see table in Figure 6, C) subjects were performing at the time (similarity of dotted line in Figure 6) Table lists correlation coefficients between response times (columns) and each of the two FFR metrics (rows), as observed within each of the three recording conditions (A = Auditory, V = Visual, N = No task). Highlighted values depict correlations significant at p<.05.
