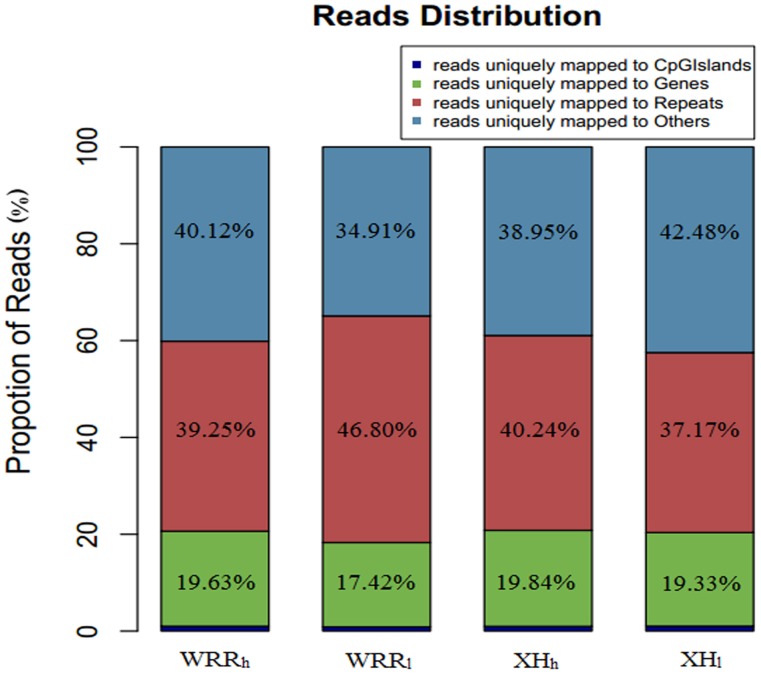
Figure 1. Genomic distribution of the uniquely mapped reads.
All uniquely mapped reads were classified into four types: reads uniquely mapped to CpG islands (dark blue), genes bodies (green), repeats (red), others (light blue). The percentage for each class was given at the top of each graph. WRRh, WRRl, XHh, and XHl indicated the group of Recessive White Rock with high body weight, Recessive White Rock with low body weight, Xinhua Chickens with high body weight, and Xinhua Chickens with low body weight, respectively.

