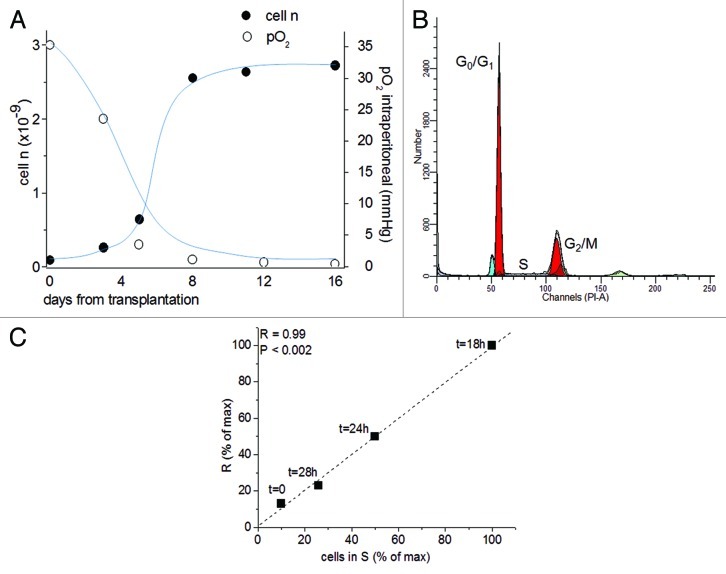
Figure 2. The role of the mitochondrial respiration on the G1/S transition. (A) Time-course of pO2 (open circles) and AH130 tumor development in vivo (closed circles) at various time after transplantation. The pO2 measurements were obtained by a Clark-type microelectrode (Beckman, 315780) mounted on the Beckman Physiological Gas Analyzer (Mod.160) connected to a recorder, according to Del Monte (1967). (B) Cell cycle distribution of AH130 cells at day 11 after transplantation as measured by cytofluorimetric technique. (C). Linear correlation between the number of cells recruited into S as measured by the R = 14C-Thymidine pulse (DPM/90 min/106 viable cells) and by cytofluorimetric technique at the corresponding times. The latter parameter was estimated by multiplying the cytofluorimetric percentage of cells in S for the total number of cells present in the sample at the corresponding time. Note the synchronization of the cells in the S phase at t = 18 as compared with t = 0.

An official website of the United States government
Here's how you know
Official websites use .gov
A
.gov website belongs to an official
government organization in the United States.
Secure .gov websites use HTTPS
A lock (
) or https:// means you've safely
connected to the .gov website. Share sensitive
information only on official, secure websites.
