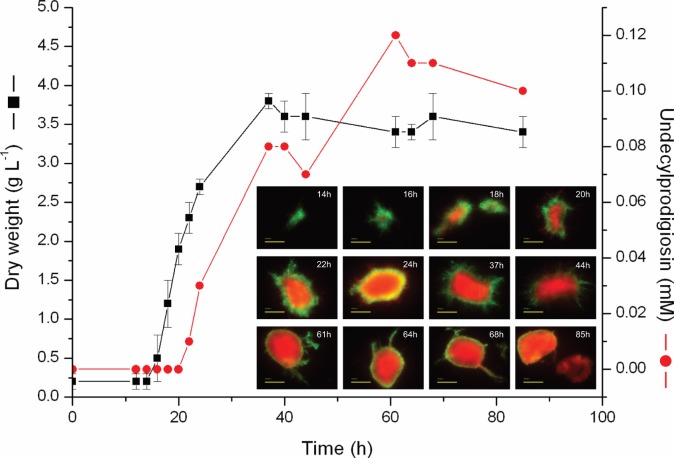
Figure 4. One generation of pellet development where BacLight live/dead staining highlights the cell heterogeneity within a pellet.
As pellets grow in size, the red area spread from the core of the pellet to eventually covering the whole pellet. Green fluorescence (SYTO9) is associated with live cells; Red fluorescence propidium iodide (PI) stains dead cells. Bar = 100 μm. Bacterial growth was monitored by dry weight weight (black squares). Antibiotic production is shown as undecylprodigiosin concentration (red circles). The error bars illustrate the standard deviation (n = 3).

