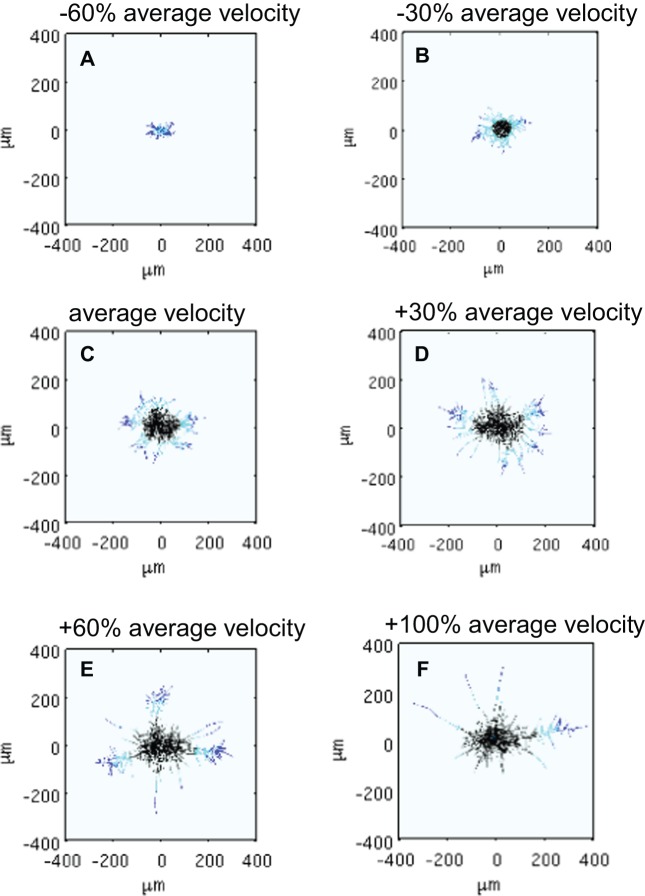
Figure 9. Increasing hyphal elongation velocity affects the network morphology.
Simulation results show the shape of a network using an average tip elongation rate that is −60% (A), −30% (B), 0% (C), +30% (D), +60% (E) and +100% (F) of the experimentally observed value (6.3 μm/h). Note that to accommodate the increased velocities, the domain size was increased to 500 μm×500 μm, 600 μm×600 μm, 800 μm×800 μm in (D), (E) and (F), respectively. Note: the images were manually adjusted to show 400 μm×400 μm coordinates to allow a comparison between the different cases.

