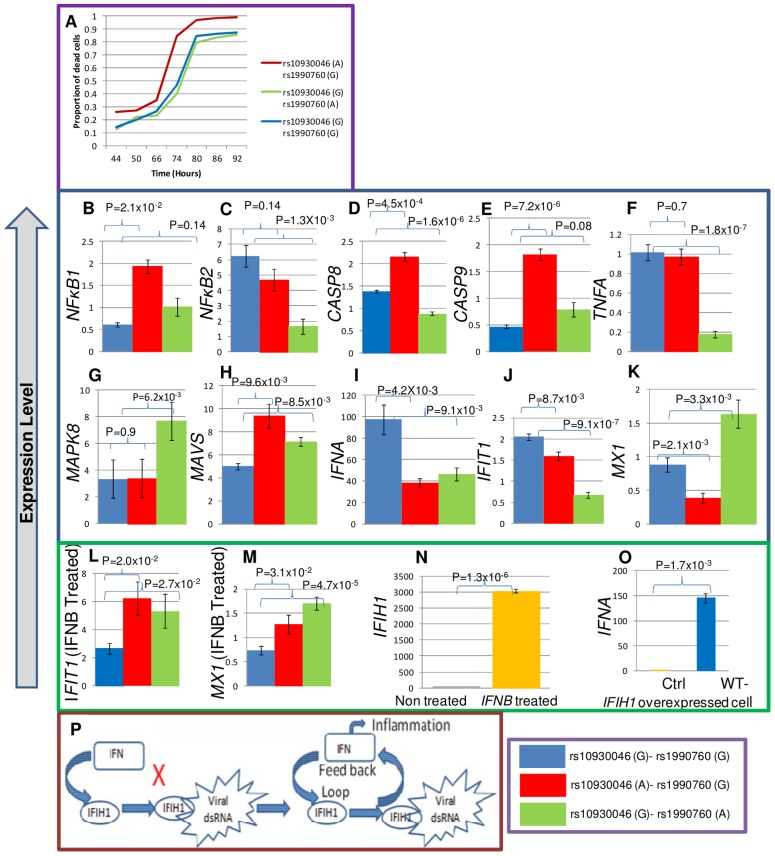
Figure 3. Apoptosis and expression assays for exonic SNPs.
(A) K652 cells were transfected with IFIH1 full length cDNA containing the protective ‘G’ or risk ‘A’ allele for rs10930046 and rs1990760 in the following combinations: ‘A-G’, ‘G-A’ and ‘G-G’. After transfection, the percentage of apoptotic cells was quantified by FACS for annexin V and AAD positivity among GFP+ cells (transfection positive) at seven different time points (in hours). At all time points, the risk allele ‘A’ for rs10930046 produced a significant increase in the proportion of apoptotic cells compared to the ‘G’ allele (mean increase 14.6%, P≤1.4×10⁻³, ‘A-G’ vs ‘G-G’). In contrast, the ‘A’ allele for rs1990760 had no significant effect on apoptosis compared to the ‘G’ allele at any time point (P = 1, ‘G-A’ vs ‘G-G’). IFIH1 cDNA encoding the risk or protective allele of rs10930046 or rs1990760 was transiently transfected, GFP+ cells were sorted by FACS and total RNA was isolated. cDNAs were subjected to RT-qPCR for quantification of expression of NFκ-B1, NFκ-B2, CASP8, CASP9, TNFA, MAPK8, MAVS, IFNA, IFIT1 and MXI (B–K). All of these genes showed significantly altered expression with at least one of the risk alleles. Further, we observed that IFIT1 and MX1 (L, M) expression both increased with risk alleles when transfected cells were treated with IFN beta. Also, IFN beta stimulation increased IFIH1 expression (N), and IFIH1 over-expression induced IFNA expression (O), suggesting a positive feedback loop between IFNA and IFIH1 (P). Although it was known that IFNA induces IFIH1 expression, it was not previously shown that IFIH1 induces IFNA expression, which here is designated by “X”. Colors used in the expression figures are blue for ancestral ‘G-G’, red for rs10930046-‘A’+rs1990760-‘G’; and green shows rs10930046-‘G’+rs1990760-‘A’.

