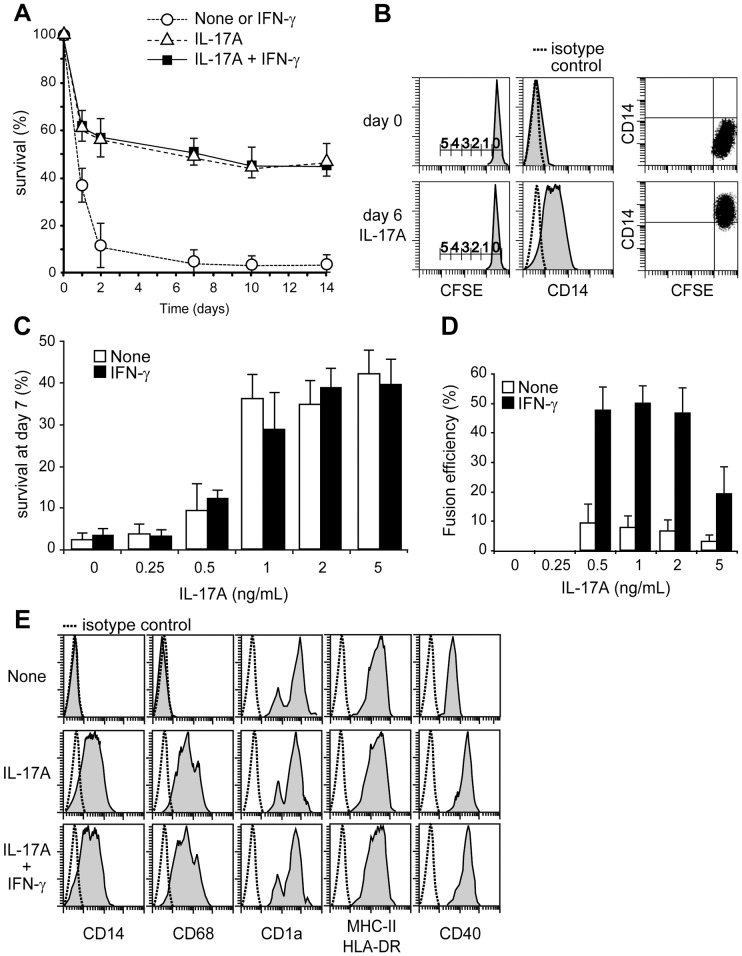
Figure 1. Survival, proliferation, fusion and phenotype of IL-17A and IFN-γ-treated DC.
(A) Kinetic study of cell survival in long-term culture of DC with indicated cytokines, assessed by TRAP and Hoechst staining. Mean and SD of n = 7. (B) Flow cytometry analysis of CD14 expression and DC divisions (CFSE staining) at day 0 and 6 after addition of IL-17A. Scale bar indicates number of cell divisions, representative of n = 3. (C) IL-17A-dependent dose response study of DC survival, at day 7 of culture with indicated cytokines, assessed by DiOC6 and PI staining. Mean and SD, n = 3. (D) IL-17A-dependent dose response study of DC fusion, at day 12 of culture with indicated cytokines, assessed by TRAP and Hoechst staining. Mean and SD, n = 4. (E) Expression (gray) of CD14, CD68, CD1a, HLADR and CD40 by monocyte-derived DC at day 0 (None) and 48 h after culture with IL-17A +/− IFN-γ, representative of n >5.

