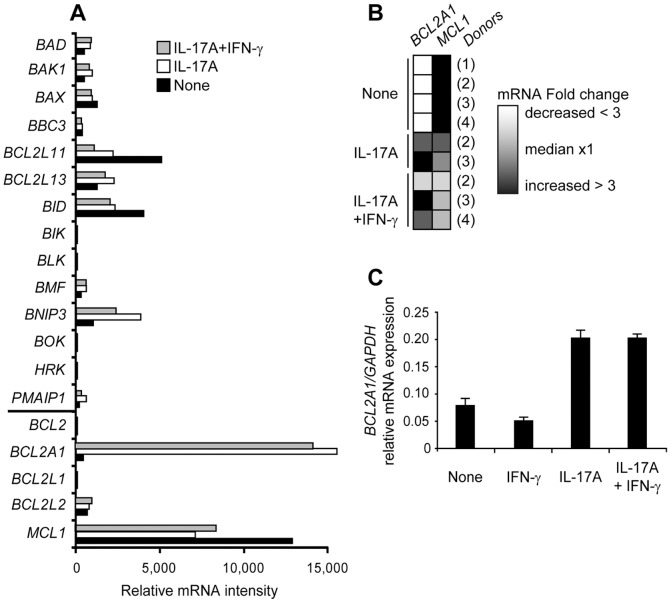
Figure 3. Bcl-2 family mRNA expression in IL-17A and IFN-γ-treated monocyte-derived DC.
(A,B) DC at day 0 (None) or treated 12 days with IL-17A +/− IFN-γ. (A) Whole study of Bcl-2 family mRNA intensities by microarray, left horizontal bar on Y axis separates pro-apoptotic members (top) from pro-survival members (bottom), representative of n = 4. (B) Fold change heat map of BCL2A1 and MCL1 mRNA from normalized experiments and four donors (1) to (4), as indicated. White and black color gradients reflect decrease and increase in fold change, respectively. (C) mRNA levels of BCL2A1 measured by real-time PCR in DC at day 0 (None) and 48 h of culture with IFN-γ or IL-17A or both. Mean and SD of duplicate of relative gene expression (compared with GAPDH) for one donor, representative of n = 3.

