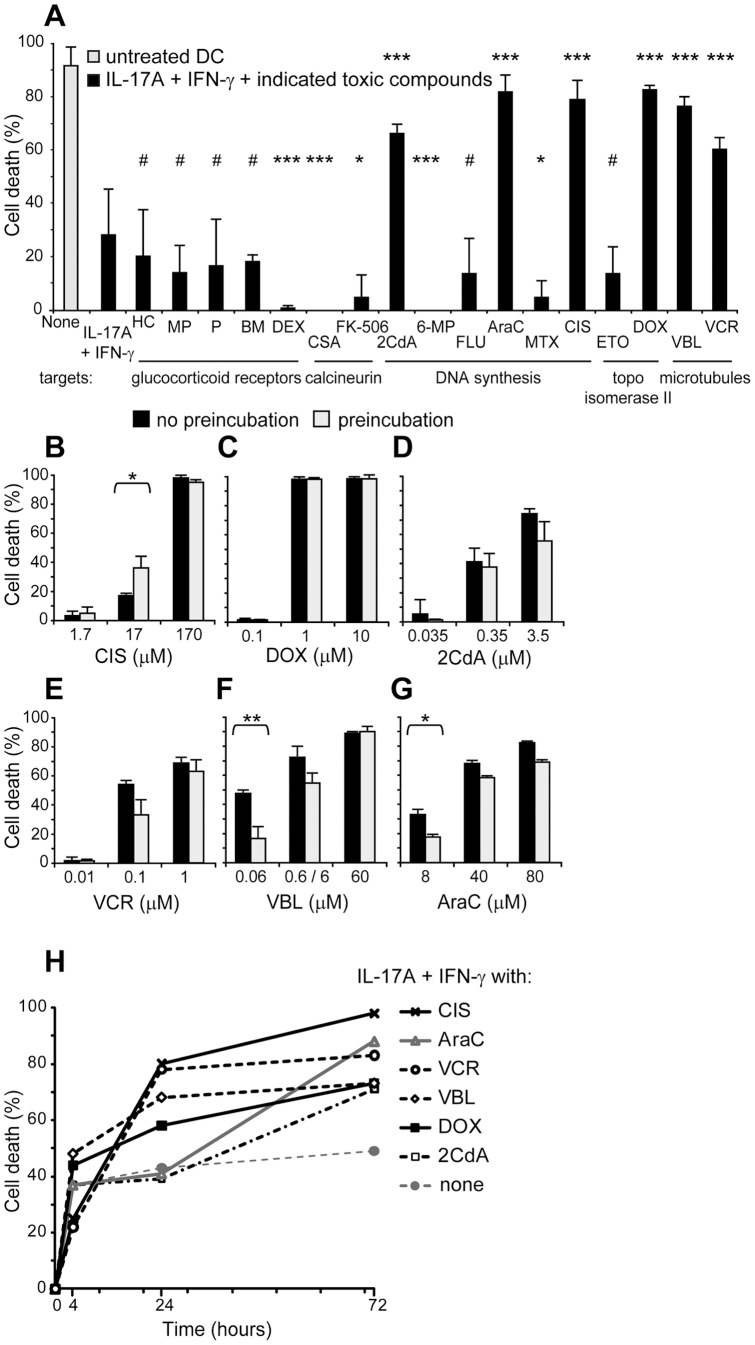
Figure 7. Chemoresistance of IL-17A and IFN-γ-treated DC in the presence of 17 chemotherapy agents.
(A–H) Flow cytometry analysis of cell death assessed by DiOC6 and PI staining. (A) DC were cultured 72 h in medium alone (gray) or with IL-17A and IFN-γ (black). Indicated toxic compounds were added together with cytokines and cell death were analyzed 4 h, 24 h or 72 h later. Results of the screening are presented at optimal killing effect (see Methods S1 and Table S1 for full names of toxic compounds and optimal dose). p-values : #, not significant: *, significant p<0.05; **, very significant p<0.01; ***, highly significant p<0.001. For the six toxic compounds (2CdA, AraC, CIS, DOX, VBL and VCR) that killed cytokine-stimulated DC: (B–G) Dose response study at optimal time, 24 or 72 h after addition of toxic compounds, according to (H). Toxic compounds were added in DC cultures either concomitantly (black) or 24 h later (gray, preincubation) stimulation with IL-17A and IFN-γ. (H) Kinetic study at optimal concentration, according to (B–G). Mean and SD of a triplicate experiment representative of (A) n = 5, (B–G) n = 3 and (H) n = 3, SD below 10%.

