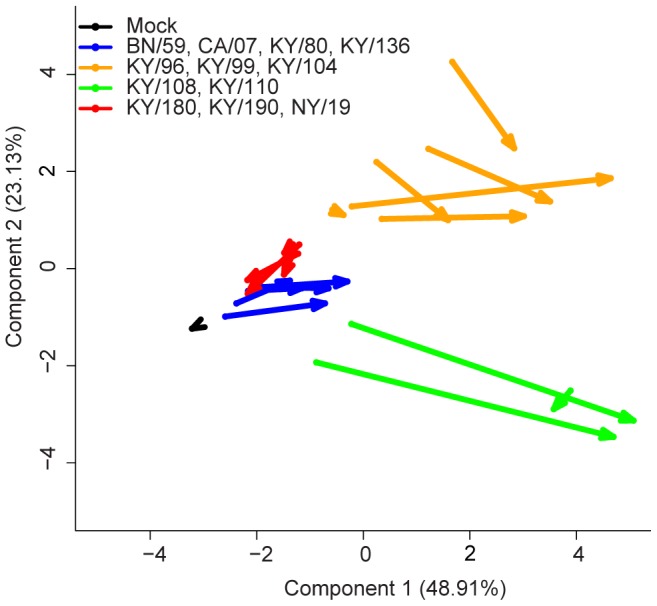
Figure 3. Principal components analysis of immune responses in lungs of mice to infection with pandemic and seasonal influenza viruses.

A principal components analysis was performed using the 14 cytokines/chemokines analytes shown to be the most significantly different across all isolates from days 3 and 6 (determined by generalized linear model fitness testing, data not shown). The data were normalized and scaled (zero mean-centered) cytokine responses after influenza infection at 3 and 6 DPI for all viruses. The ordinate and abscissa represent the first and second components from the PCA, which explain approximately 72% of the variance. Each arrow represents the mean of a virus isolate tested in mice. Arrow tails represent day 3 components and arrow heads represent day 6 components. Using this tool to visualize the immune response, the arrows depict the trajectory of disease of the various influenza isolates as tested in DBA/2 mice. Additionally, the 12 virus isolates clustered into four distinct patterns: Group 1, BN/59, CA/07, KY/80, KY/136; Group 2, KY/96, KY/99, KY/104, KY/108; Group 3, KY/108, KY/110; Group 4, KY/180, KY/190, NY/18 (See Table S5).
