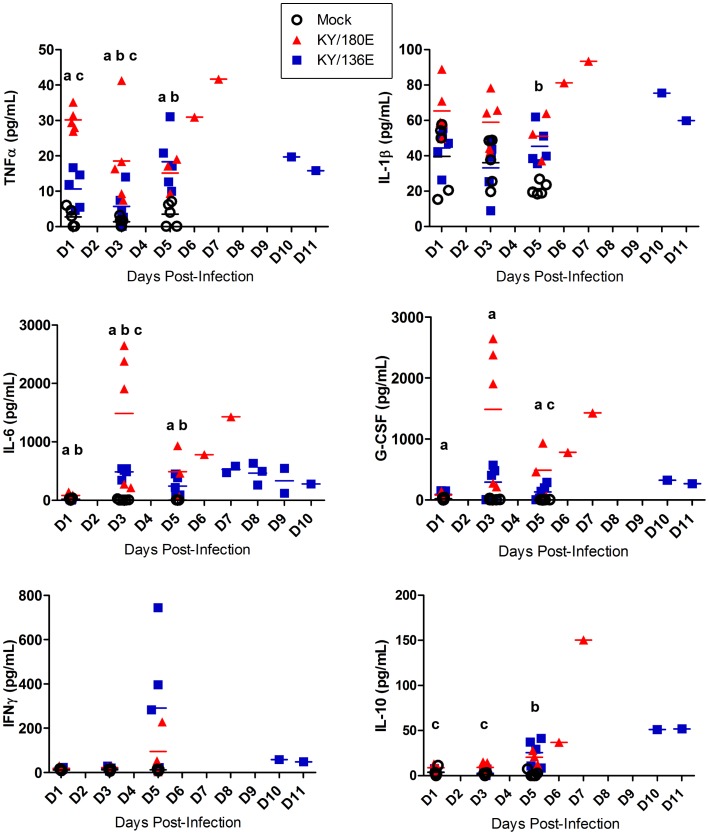
Figure 5. Cytokine levels in mice infected with KY/136 or KY/180.
The levels of notable cytokine responses are shown for 1, 3 and 5 DPI in six to eight week old DBA/2 mice that were infected intranasally with 105 TCID50 of KY/180E or KY/136E (n = 10 mice per virus group per time point). Statistical significance was determined by day using Kruskal-Wallis test followed by pairwise Wilcoxon Rank Sum post hoc test with Holm’s adjustment for multiple comparisons. P-values <0.05 are indicated by the following method: “a” = KY/180 is significantly different from mock; “b” = KY/136 is significantly different from mock; “c” = KY/180 is significantly different from KY/136.

