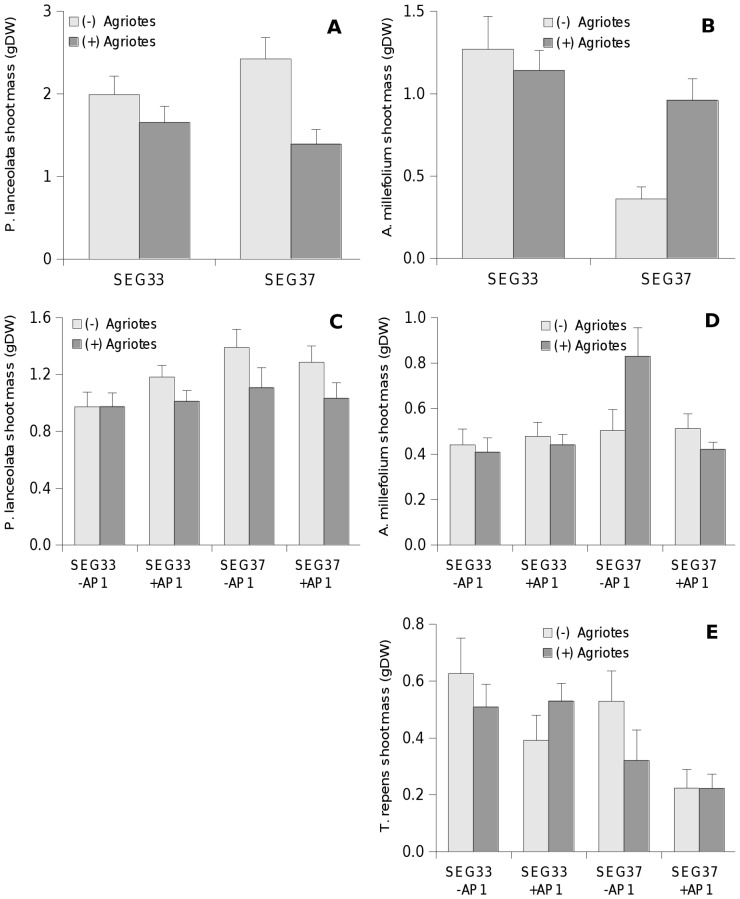
Figure 1. Shoot biomass (mean + se) of plants affected by the presence of Agriotes larvae.
Phase 1 (A) P. lanceolata (B) A. millefolium; phase 2 (C) P. lanceolata (D) A. millefolium, (E) T repens; SEG33, SEG37: soil biota from respective grassland sites; −AP1, +AP1: untrained and Agriotes trained soil from phase 1, respectively.

