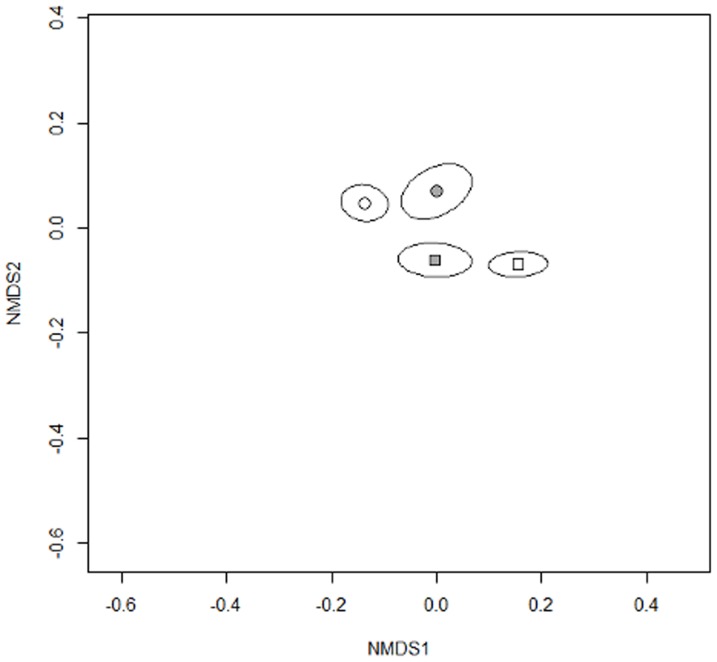
Figure 2. Non-metric multidimensional scaling plot of AMF communities in soils after phase 2.
Circles and squares give centroids (means) of AMF communities for SEG33 and SEG37, respectively, open symbols show those of untrained and filled symbols those of trained AMF communities. Ellipsoids give standard error. The two soil biota origins are clearly differentiated along the second axis while the Agriotes training leads to opposing community shifts along the first axis.

