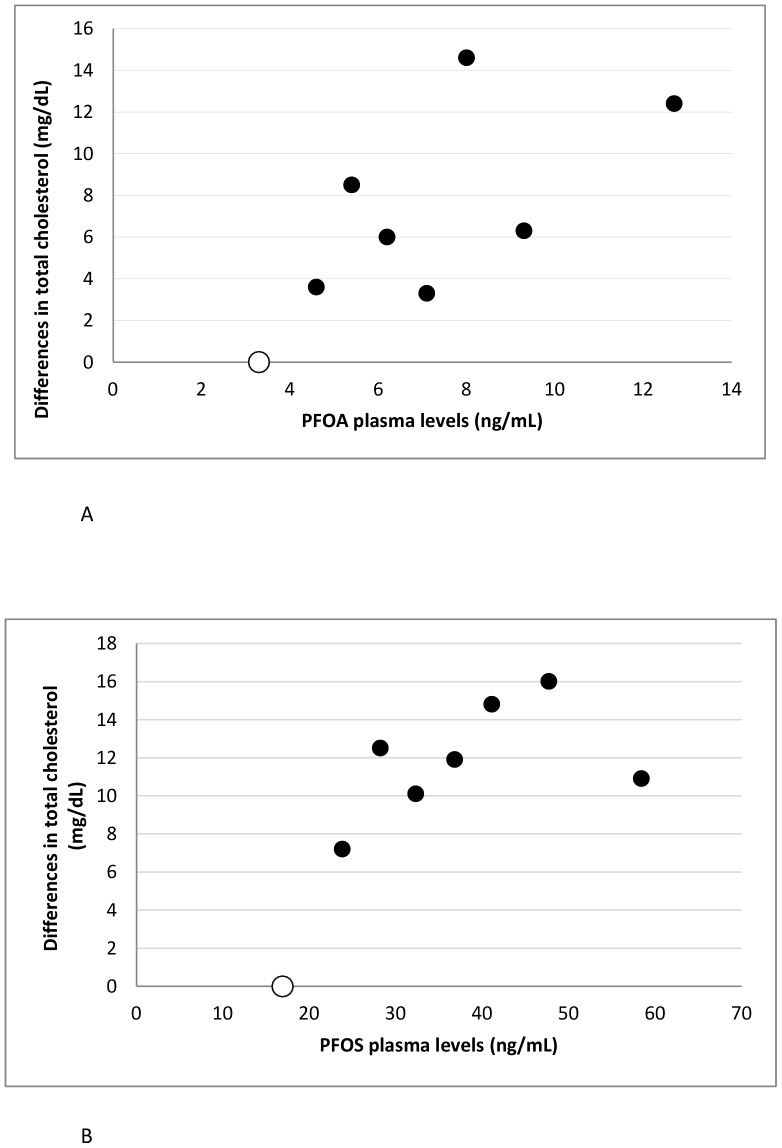
Figure 2. Associations between plasma PFOA and PFOS levels and total cholesterol.
The Figure illustrates differences in total cholesterol levels according to eight exposure groups of (A) PFOA and (B) PFOS. The lowest exposure groups are used as reference (open dots). The dots are placed at the median of the eight exposure categories. Models are adjusted (sex, age, years of school attendance, body mass index, smoking status, alcohol intake, egg intake, animal fat intake and physical activity).

