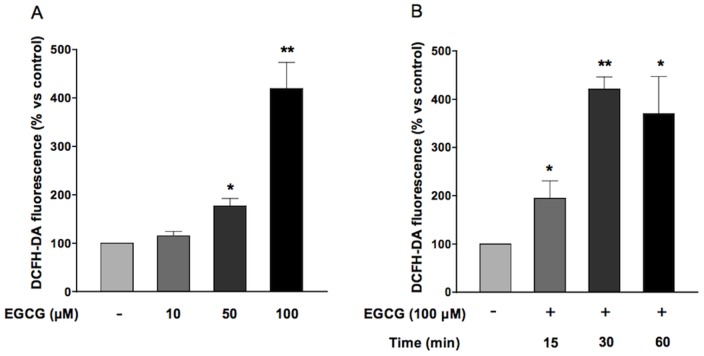
Figure 1. Effect of EGCG on intracellular ROS production.
A) HUVECs were treated with EGCG (10, 50, 100 µM) for 30 minutes. B) HUVECs were treated with EGCG 100 µM for increasing times (15, 30, 60 min). Values are expressed as percentage ± SE (n = 14, A; n = 5, B) of the amount of ROS generated under basal conditions. *P<0.05, **P<0.1 vs control.

