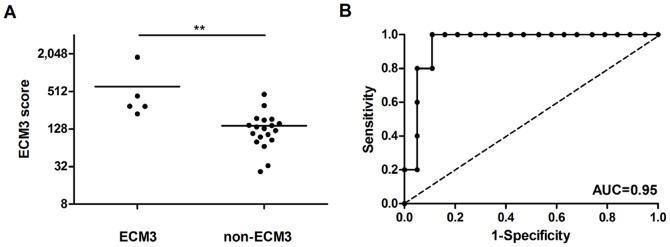
Figure 2. ECM3 classification of breast carcinomas by qRT-PCR.

(A) qPCR analysis of ECM3 score derived from the average expression levels of COL1A1, COL5A2, SPARC and LAMA4 genes on FFPE specimens of 24 breast tumors of the ITA cohort [13] classified as ECM3 or non-ECM3 by unsupervised clustering. ** p<0.01 in unpaired t-test. (B) Receiver-operator characteristics (ROC) curve for expression of ECM3 genes in the ECM3 tumor subgroup.
