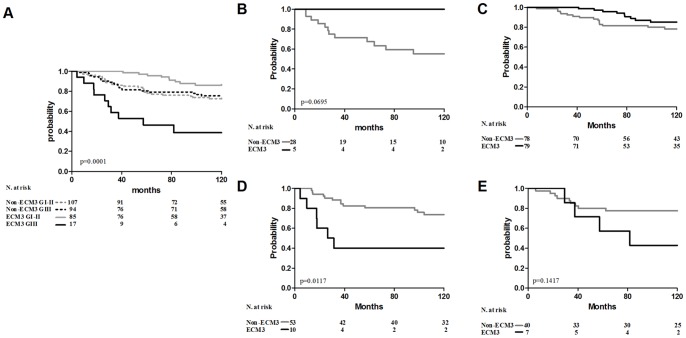
Figure 4. ECM3 prognostic significance in relation to differentiation status.
(A) Association between ECM3 grade III (ECM3 GIII, solid black line), non-ECM3 grade III (non-ECM3 GIII, dotted black line), ECM3 grade I–II (ECM3 GI-II, solid grey line) and non-ECM3 grade I–II (non-ECM3 GI-II, dotted grey line) with DMFS in untreated patient joined datasets. (B–E) Association between ECM3 (black line) and non-ECM3 (grey line) with DMFS in ER-negative grade I–II (B), ER-positive grade I–II (C), ER-negative grade III (D) and ER-positive grade III (E) subgroups. p-values by log rank test.

