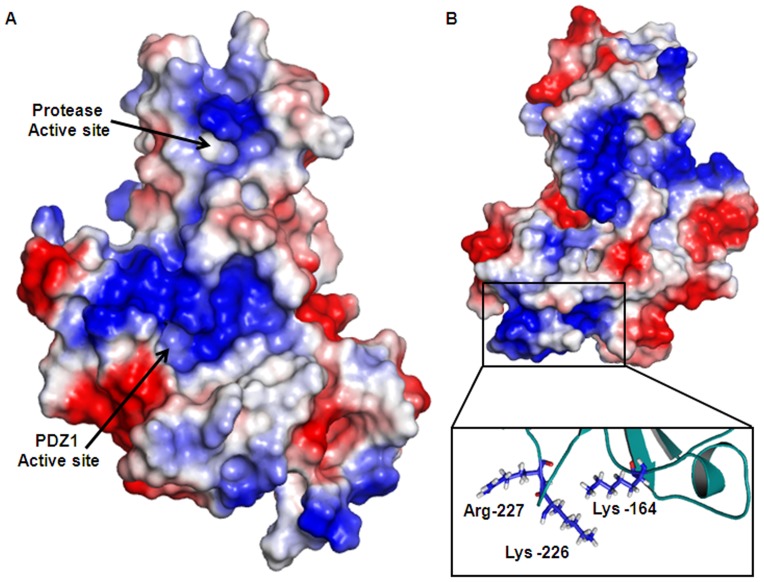
Figure 9. Surface electrostatic potential calculated by PyMOL.
The positive charge shown in Blue and negative charge shown in Red. A. The active site of protease and PDZ1 domain showing more positively charge and less neutral environment. B. The outer surface of VCO395_1035 showing the blue patches spreads all over the molecule. The positive charge shown in rectangular frame is aggregated from Argine and Lysine residue. The inset shows orientation of Arg-164 & 227 and Lys-226 residue in cartoon representation, which are predicted to interact with outer membrane.

