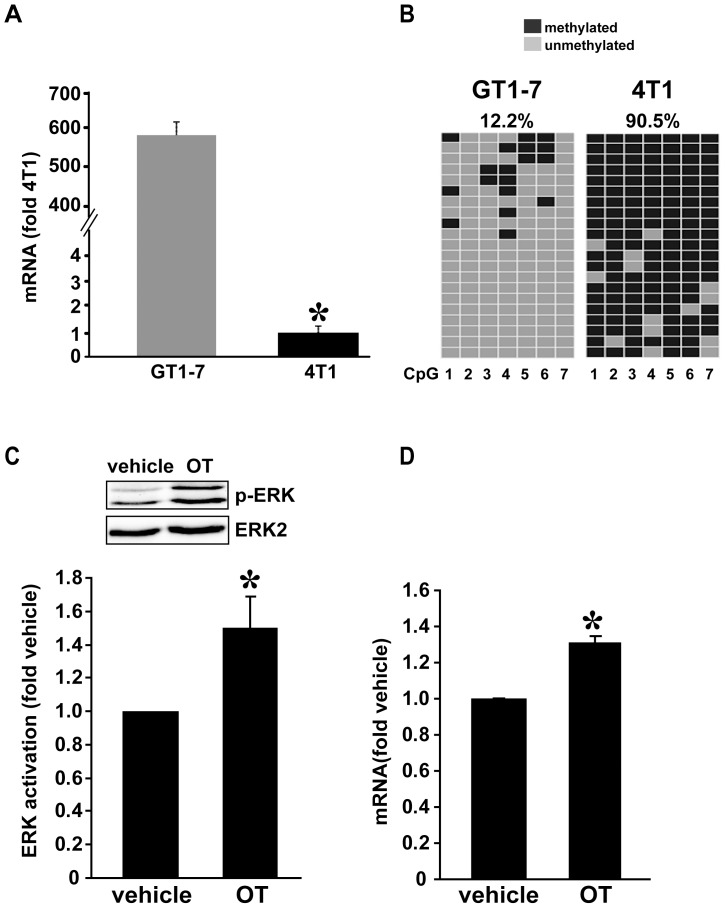
Figure 2. Oxtr mRNA levels correlate with Oxtr promoter methylation in cell lines.
A) The relative mRNA levels in GT1-7 are significantly higher than in 4T1 cells. B) Methylation of the seven CpG sites is higher in 4T1 cells than in GT1-7 cells. Each row represents a single clone and each column represents one of the seven CpG sites. The total percentage of methylation was calculated from the fraction of black spots (methylated CpG sites). C) Representative gel showing greater ERK phosphorylation in GT1-7 cells stimulated with 1 µM OT for 10 min compared vehicle-treated cells Graph is summary of three independent experiments. D) Quantities of Oxtr mRNA in GT1-7 cells following 24 h treatment with 1 µM OT. An OT-stimulated increase in Oxtr mRNA was documented in three independent experiments. Statistics (t-test): A) *p<0.001, n = 4. C) *p<0.05, n = 3. D) *p<0.01 n = 3.

