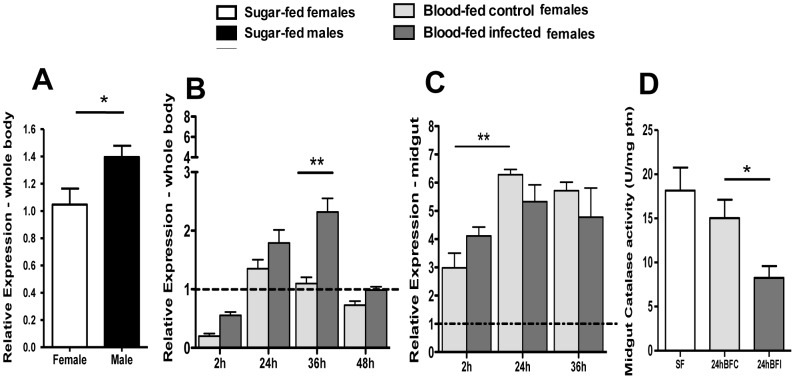
Figure 3. Expression levels of catalase in A. aquasalis according to gender and feeding regimens.
A: mRNA relative expression of catalase in whole body of sugar-fed males and females; B and C: mRNA relative expression of catalase in the mosquito whole body and midgut, respectively, of sugar-fed females (dotted line), females after blood-feeding and after P. vivax infection; D: midgut catalase activity in sugar-fed (SF), 24 h after blood-feeding (BFC) and after P. vivax infection (BFI) reported as units per minute per micrograms of protein (U/mg ptn). Data are reported as the mean ± SEM. h – hours. * p<0.05, ** 0.03>p>0.01, *** p<0.01. In figure A the data was analyzed by t-student or the Wilcoxon tests, in figure B and C by ANOVA test with multiple comparisons of Tukey or Games-Howell or Kruskal-Wallis test with multiple comparisons of Dunn's, and in figure C by ANOVA test with Dunnett's Multiple Comparison Test.

