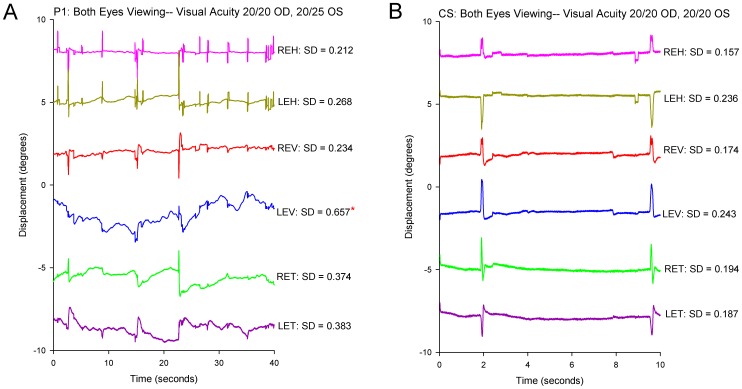
Figure 2. Representative records comparing binocular fixation behavior in P1 with monocular visual impairment versus a control subject.
The scales are similar to allow direct comparison between P1 (A) and the control subject (B). In this and similar subsequent time plots of eye movements, positive values indicate eye rotations to the right, upward, or clockwise from the subject’s viewpoint. At the top, visual acuity of each eye is stated. At the right, the SD of eye position (in degrees) is specified for each directional component of their eye movements. REH: right eye horizontal; LEH left eye horizontal; REV: right eye vertical; LEV: left eye vertical; RET: right eye torsional; LET: left eye torsional. Note the increased instability of gaze in P1’s left eye, especially in the vertical plane (LEV). The asterisk indicates that the SD value is significantly larger (p<0.05) than pooled data from normal subjects.

