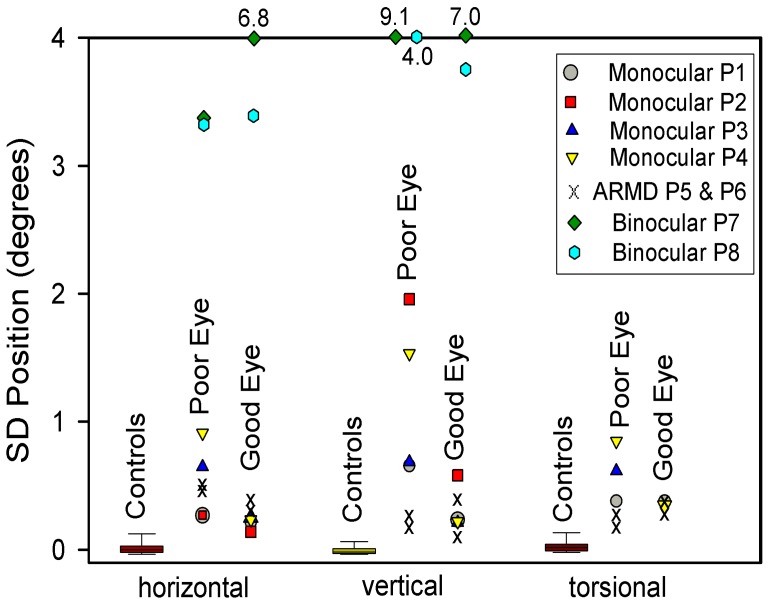
Figure 3. Summary of measurements of gaze stability, expressed as SD of eye position, for 20 control subjects (box plots) and for individual patients studied for each directional component.
Note how especially vertical gaze has greater SD values, indicating greater instability, in the poor eye (lower visual acuity) of patients with monocular visual loss compared with control subjects. Also note how P7 and P8, with binocular visual loss, have much greater SD values (most unstable gaze) compared with either control subjects or patients with monocular visual loss. Outlier values are stated at the top of the plot.

