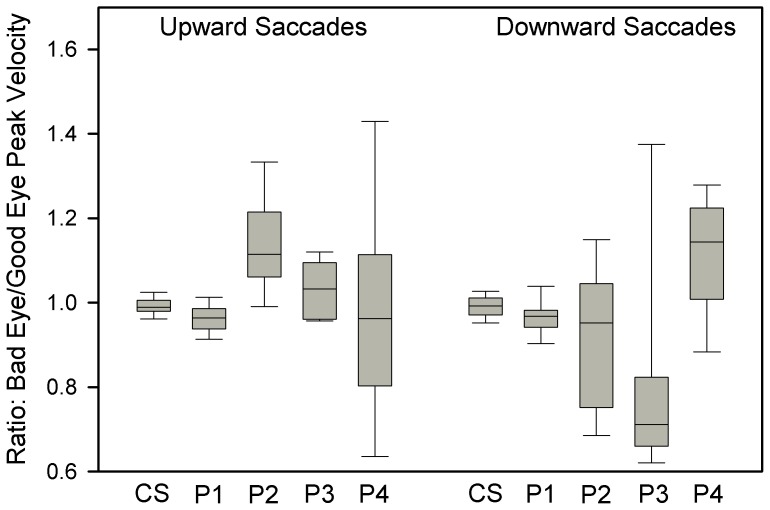
Figure 8. Summary of measurements of ratio of peak velocity of bad eye/peak velocity of good eye for upward and downward saccades of the group of control subjects (CS) and P1-4, who had monocular loss of vision early in life.
Box plot conventions are similar to Figure 1. Perfectly conjugate saccades would have a ratio of 1.0. Upward saccades made by the patients are generally more conjugate than downward saccades.

