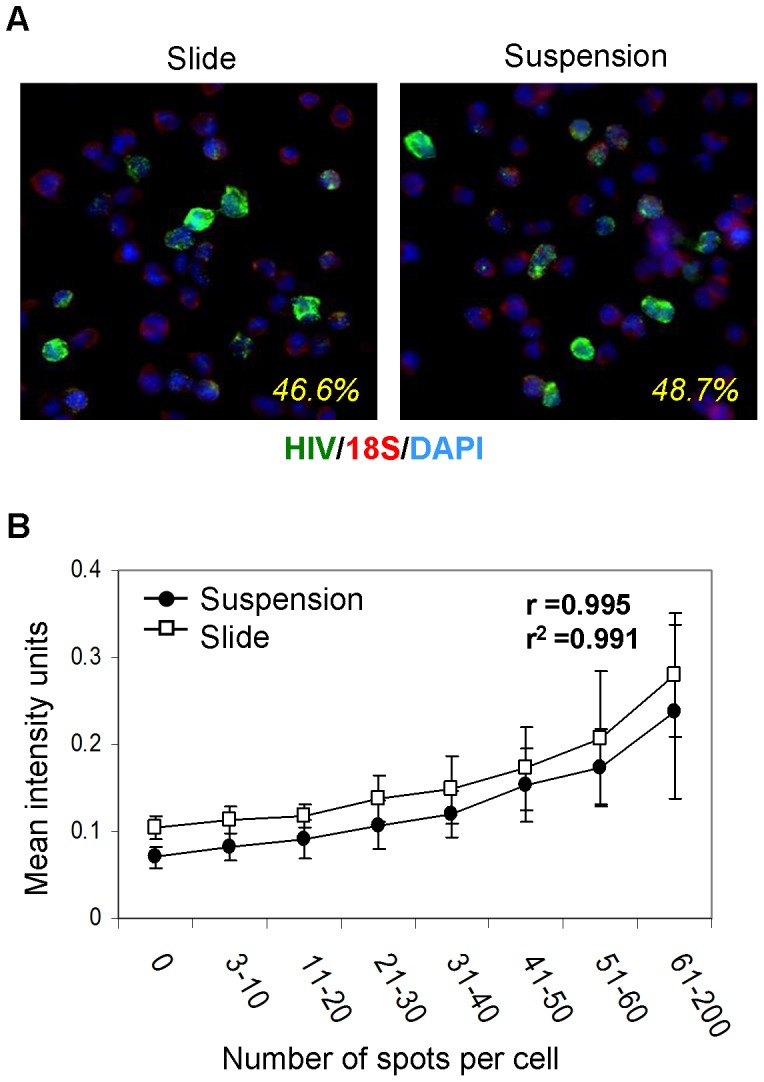
Figure 2. Comparison of HIV gag RNA in situ detection by a slide-based method vs a suspension-based method.

(a) Pseudocolor-merged 40x images of a 1:1 mixture of H9 and H9IIIB cells via the slide-based RNA detection method (left) and the suspension method (right) of HIV gag RNA-Alexa Fluor® 546, 18 s rRNA-FITC, and DAPI. The calculated frequencies for HIV gag+18 s+ RNA for each are depicted in each image. (b) Mean intensity comparison of HIV gag for different HIV gag spot count ranges (bins) with the suspension-based and slide-based methods. Error bars depict the standard deviation within each spot count bin. The correlation coefficient, r, and the coefficient of determination, r2, are shown on the graph.
